绘制带有颜色的模型
Posted 拉风小宇
tags:
篇首语:本文由小常识网(cha138.com)小编为大家整理,主要介绍了绘制带有颜色的模型相关的知识,希望对你有一定的参考价值。
在这之前我的模型一直都是单一灰白颜色的,这篇博文中我将介绍带颜色的模型
其实在obj文件中在每个点(v)的三个坐标后面再跟上三个数就可以表示模型的颜色啦~
这三个数就是RGB的数,表示的是模型的颜色,关于RGB参考https://en.wikipedia.org/wiki/RGB_color_model
那么下一个问题就是怎样把一个一维数组的大小按照颜色来表示出来呢
用颜色表示数值大小
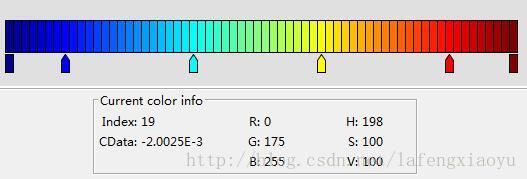
我这里借用了matlab里的colormap

运行colormap,可以看到其实是对应的64个3位数,所以只需把这些数里最小的对应第1个三位数,最大的对应第64个即可~,如果想用别的colormap,直接换掉相对应的矩阵就好啦。对应的写入obj文件的函数为
function obj_write_col(filename,vertices,faces,colors )
%TEST Summary of this function goes here
% write matrix to file
vertices=vertices';
faces=faces';
colors=colors';
fid=fopen(filename,'w');
[x,y]=size(vertices);
for i=1:x
fprintf(fid,'v ');
for j=1:y-1
fprintf(fid,'%f ',vertices(i,j));
end
fprintf(fid,'%f ',vertices(i,y));%每一行回车\\n
for j=1:y-1
fprintf(fid,'%f ',colors(i,j));
end
fprintf(fid,'%f\\r\\n',colors(i,y));%每一行回车\\n
end
fprintf(fid,'\\n');
% for i=1:x
% fprintf(fid,'vn ');
% for j=1:y-1
% fprintf(fid,'%f ',normals(i,j));
% end
% fprintf(fid,'%f\\r\\n',normals(i,y));%每一行回车\\n
% %fprintf(fid,'\\n');%每一行回车\\n
% end
fprintf(fid,'\\n');%每一行回车\\n
[x,y]=size(faces);
for i=1:x
fprintf(fid,'f ');
for j=1:y-1
fprintf(fid,'%d ',faces(i,j));
end
fprintf(fid,'%d\\r\\n',faces(i,y));%每一行回车\\n
%fprintf(fid,'\\n');%每一行回车\\n
end
fclose(fid);
end
其中colors由下面的函数得到
function colors = transfer_data2color( data )
%TRANSFER_DATA2COLOR Summary of this function goes here
%   Detailed explanation goes here
n=size(data,1);
colors=zeros(n,3);

Mindata=min(data);Maxdata=max(data);
spice=(Maxdata-Mindata)/64;
data=data-Mindata;

colormap=[0         0    0.5625
         0         0    0.6250
         0         0    0.6875
         0         0    0.7500
         0         0    0.8125
         0         0    0.8750
         0         0    0.9375
         0         0    1.0000
         0    0.0625    1.0000
         0    0.1250    1.0000
         0    0.1875    1.0000
         0    0.2500    1.0000
         0    0.3125    1.0000
         0    0.3750    1.0000
         0    0.4375    1.0000
         0    0.5000    1.0000
         0    0.5625    1.0000
         0    0.6250    1.0000
         0    0.6875    1.0000
         0    0.7500    1.0000
         0    0.8125    1.0000
         0    0.8750    1.0000
         0    0.9375    1.0000
         0    1.0000    1.0000
    0.0625    1.0000    0.9375
    0.1250    1.0000    0.8750
    0.1875    1.0000    0.8125
    0.2500    1.0000    0.7500
    0.3125    1.0000    0.6875
    0.3750    1.0000    0.6250
    0.4375    1.0000    0.5625
    0.5000    1.0000    0.5000
    0.5625    1.0000    0.4375
    0.6250    1.0000    0.3750
    0.6875    1.0000    0.3125
    0.7500    1.0000    0.2500
    0.8125    1.0000    0.1875
    0.8750    1.0000    0.1250
    0.9375    1.0000    0.0625
    1.0000    1.0000         0
    1.0000    0.9375         0
    1.0000    0.8750         0
    1.0000    0.8125         0
    1.0000    0.7500         0
    1.0000    0.6875         0
    1.0000    0.6250         0
    1.0000    0.5625         0
    1.0000    0.5000         0
    1.0000    0.4375         0
    1.0000    0.3750         0
    1.0000    0.3125         0
    1.0000    0.2500         0
    1.0000    0.1875         0
    1.0000    0.1250         0
    1.0000    0.0625         0
    1.0000         0         0
    0.9375         0         0
    0.8750         0         0
    0.8125         0         0
    0.7500         0         0
    0.6875         0         0
    0.6250         0         0
    0.5625         0         0
    0.5000         0         0];

for i=1:n
    num=floor(data(i)/spice)+1;
    if num==65
        num=64;
    end
    colors(i,:)=colormap(num,:);

end

end
测试与演示
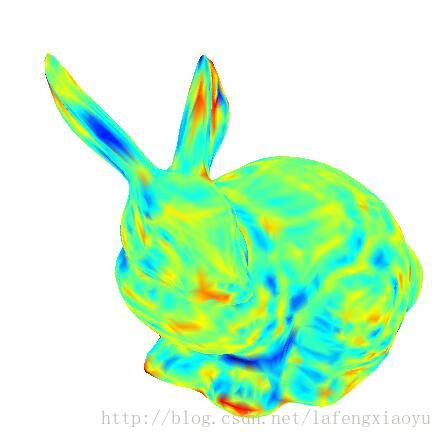
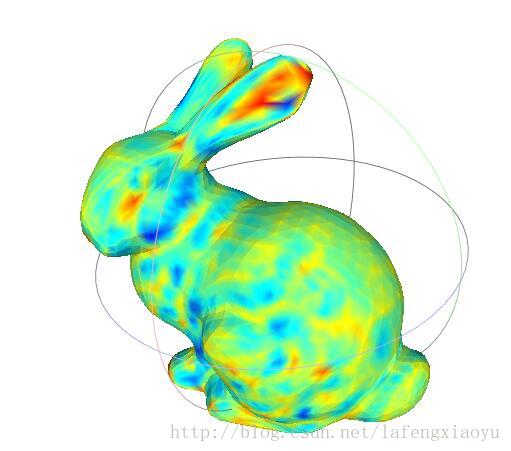
拿之前误差的那个测试一下,数值的大小表示网格误差,越大表示相比原来的网格突出来越多,反之凹进去越多
obj1='rabbit_500_optimal_wm_norm_angle10.obj';
obj2='rabbit_origin.obj';
OBJ1=readObj(obj1);V1=OBJ1.v;F1=OBJ1.f.v;
OBJ2=readObj(obj2);V2=OBJ2.v;F2=OBJ2.f.v;
[distances12 ] = point2mesh_allerror( F2,V2,V1 );
trep=triangulation(F1,V1);
figure(2);colormap jet;trisurf(trep,distances12,'edgecolor','interp','FaceColor','interp');caxis([min(distances12) max(distances12)]);...
axis square;colorbar('vert');brighten(-0.1);axis off;
colors = transfer_data2color( distances12 );
obj_write_col('hehe.obj',V1',F1',colors' );
 |  |
| matlab直接绘制 | obj文件显示 |
其实matlab的效果还是有点。。聒噪
-----------
有评论需求文章中的函数,贴在后面(2019.3.20)
function [ distances] = point2mesh_allerror( faces,vertices,qPoints )

assert(~isempty(faces) && ~isempty(vertices), 'Invalid argument: ''Faces'' and ''Vertices'' mustn''t be empty.')
assert(max(faces(:))<=size(vertices,1), 'The value of ''Faces'' is invalid: the maximum vertex ID is bigger than the number of vertices in ''Vertices''')

% Calculate normals
r1 = vertices(faces(:,1),:);  % (#faces x 3) % 1st vertex of every face
r2 = vertices(faces(:,2),:);  % (#faces x 3) % 2nd vertex of every face
r3 = vertices(faces(:,3),:);  % (#faces x 3) % 3rd vertex of every face
normals = cross((r2-r1),(r3-r1),2); % (#faces x 3) normal vector of every face
normals = bsxfun(@rdivide,normals,sqrt(sum(normals.^2,2))); % (#faces x 3) normalized normal vector of every face

if isempty(qPoints)
    distances = [];
    return
end


%% Distance Calculation

nQPoints = size(qPoints,1);

D = NaN(nQPoints,1);


 %case 'linear','normal'
 for r = 1:nQPoints
     % Determine the surface points
     point = qPoints(r,:); % (1 x 3) query point
     [d] = processPoint(faces,vertices,point,normals,@distance_to_vertices,@distance_to_edges,@distance_to_surfaces);
     D(r) = d;

 end


% return output arguments
distances      = D;  % (#qPoints x 1)


end

function D = processPoint(faces,vertices,point,normals,distance_to_vertices,distance_to_edges,distance_to_surfaces)

d = NaN(3,1); % (distanceTypes x 1)


d(1) = distance_to_vertices(faces,vertices,point,normals);
% find nearest vertice
d(2) = distance_to_edges(faces,vertices,point,normals);
d(3) = distance_to_surfaces(faces,vertices,point,normals);
% find nearest point on all edges


% find minimum distance type
[~,I] = min(abs(d),[],1);
D = d(I);
end


%% Non-vectorized Distance Functions


function [D] = distance_to_vertices(faces,vertices,qPoint,normals)

% find nearest vertex
[D,nearestVertexID] = min(sum(bsxfun(@minus,vertices,qPoint).^2,2),[],1);
D = sqrt(D);
P = vertices(nearestVertexID,:); % (1 x 3)

% find faces that belong to the vertex
connectedFaces = find(any(faces==nearestVertexID,2)); % (#connectedFaces x 1) face indices
assert(length(connectedFaces)>=1,'Vertex %u is not connected to any face.',nearestVertexID)


n = normals(connectedFaces,:); % (#connectedFaces x 3) normal vectors

% scalar product between distance vector and normal vectors
coefficients = dot2(n,qPoint-P);
sgn = signOfLargest(coefficients);
D = D*sgn;

end


function [D] = distance_to_edges(faces,vertices,qPoint,normals)

% Point-point representation of all edges
edges = [faces(:,[1,2]); faces(:,[1,3]); faces(:,[2,3])]; % (#edges x 2) vertice IDs

% Intersection between tangent of edge lines and query point
r1 = vertices(edges(:,1),:);   % (#edges x 3) first point of every edge
r2 = vertices(edges(:,2),:);   % (#edges x 3) second point of every edge
t = dot( bsxfun(@minus,qPoint,r1), r2-r1, 2) ./ sum((r2-r1).^2,2); % (#edges x 1) location of intersection relative to r1 and r2
t(t<=0) = NaN; % exclude intersections not between the two vertices r1 and r2
t(t>=1) = NaN;

% Distance between intersection and query point
P = r1 + bsxfun(@times,(r2-r1),t); % (#edges x 3) intersection points
D = bsxfun(@minus,qPoint,P); % (#edges x 3)
D = sqrt(sum(D.^2,2));       % (#edges x 1)
[D,I] = min(D,[],1);         % (1 x 1)
P = P(I,:);

% find faces that belong to the edge
inds = edges(I,:);  % (1 x 2)
inds = permute(inds,[3,1,2]);  % (1 x 1 x 2)
inds = bsxfun(@eq,faces,inds); % (#faces x 3 x 2)
inds = any(inds,3);    % (#faces x 3)
inds = sum(inds,2)==2; % (#faces x 1) logical indices which faces belong to the nearest edge of the query point
n = normals(inds,:); % (#connectedFaces x 3) normal vectors

% scalar product between distance vector and normal vectors
coefficients = dot2(n,qPoint-P); % (#connectedFaces x 1)
sgn = signOfLargest(coefficients);
D = D*sgn;

end


function [D] = distance_to_surfaces(faces,vertices,point,normals)

r1 = vertices(faces(:,1),:);   % (#faces x 3) % 1st vertex of every face
r2 = vertices(faces(:,2),:);   % (#faces x 3) % 2nd vertex of every face
r3 = vertices(faces(:,3),:);   % (#faces x 3) % 3rd vertex of every face

vq = bsxfun(@minus,point,r1);  % (#faces x 3)
D = dot(vq,normals,2);         % (#faces x 1) distance to surface
rD = bsxfun(@times,normals,D); % (#faces x 3) vector from surface to query point
P = bsxfun(@minus,point,rD);   % (#faces x 3) nearest point on surface; can be outside triangle

% find barycentric coordinates (query point as linear combination of two edges)
r31r31 = sum((r3-r1).^2,2);    % (#faces x 1)
r21r21 = sum((r2-r1).^2,2);    % (#faces x 1)
r21r31 = dot(r2-r1,r3-r1,2);   % (#faces x 1)
r31vq = dot(r3-r1,vq,2);       % (#faces x 1)
r21vq = dot(r2-r1,vq,2);       % (#faces x 1)

d = r31r31.*r21r21 - r21r31.^2;               % (#faces x 1)
bary = NaN(size(faces,1),3);                  % (#faces x 3)
bary(:,1) = (r21r21.*r31vq-r21r31.*r21vq)./d; % (#faces x 3)
bary(:,2) = (r31r31.*r21vq-r21r31.*r31vq)./d; % (#faces x 3)
bary(:,3) = 1 - bary(:,1) - bary(:,2);        % (#faces x 3)

% tri = triangulation(faces,vertices);
% bary = tri.cartesianToBarycentric((1:size(faces,1))',P); % (#faces x 3)

% exclude intersections that are outside the triangle
D( abs(d)<=eps | any(bary<=0,2) | any(bary>=1,2) ) = NaN;  % (#faces x 1)

% find nearest face for query point
[~,I] = min(abs(D),[],1); % (1 x 1)
D = D(I);       % (1 x 1)

end


function sgn = signOfLargest(coeff)
    [~,I] = max(abs(coeff));
    sgn = sign(coeff(I));
    if sgn==0, sgn=1; end
end


function d = dot2(A,B)
    % dot product along 2nd dimension with singleton extension
    d = sum(bsxfun(@times,A,B),2);
end
以上是关于绘制带有颜色的模型的主要内容,如果未能解决你的问题,请参考以下文章