关于Python可视化Dash工具—choropleth_mapbox地图实现
Posted 不胜人生一场醉
tags:
篇首语:本文由小常识网(cha138.com)小编为大家整理,主要介绍了关于Python可视化Dash工具—choropleth_mapbox地图实现相关的知识,希望对你有一定的参考价值。
有两周没更新公众号,一来是工作有点忙,二来是被地图的事情搅和的不行了,事情没搞清楚前写文档是对自己最大的不尊重,关于choropleth_mapbox地图实现,有很多坑在里面。主要的因素是对geojson不够了解,以及choropleth_mapbox对参数的解释一直是言之不详。
GeoJSON是一种对各种地理数据结构进行编码的格式,GeoJSON是用json的语法表达和存储地理数据,可以说是json的子集。GeoJSON对象可以表示几何、特征或者特征集合。GeoJSON支持下面几何类型:点、线、面、多点、多线、多面和几何集合。GeoJSON里的特征包含一个几何对象和其他属性,特征集合表示一系列特征。
GeoJSON总是由一个单独的对象组成。这个对象表示几何、特征或者特征集合。
GeoJSON对象可能有任何数目成员。
GeoJSON对象必须有一个名字为"type"的成员。这个成员的值是由GeoJSON对象的类型所确定的字符串。
type成员的值必须是下面之一:"Point", "MultiPoint", "LineString", "MultiLineString", "Polygon", "MultiPolygon", "GeometryCollection", "Feature", 或者 "FeatureCollection"。
以下是个geojosn的样例
  "type": "FeatureCollection",
  "features": [
        "type":"Feature",
        "properties":,
        "geometry":
            "type":"Point",
            "coordinates":[105.380859375,31.57853542647338]


    ]
关于全球地图、中国地图、省域地图的geojson文件均可以下载到,但格式略有区别,比如全球地图有id即国家简写,在properties下的name中也有全称。
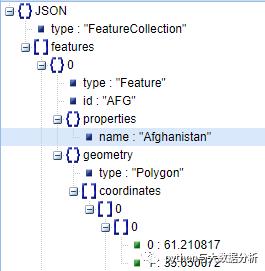
但中国地图有adcode,name、级别、中心点等等属性。

在实现choropleth_mapbox的过程中,地图一直无法正常显示,原因有二,其一plotly基于d3.js,geojson文件的加载比较耗时,而且要认为点击一下zoom out按钮才能呈现地图,其二参数不对,在下面的代码注释中已有介绍,在此不做详述了。所有的数据均为随机值,不代表任何含义。
import json
import pandas as pd
import plotly.express as px
def print_json(data):
    print(json.dumps(data, sort_keys=True, indent=4, separators=(', ', ': '), ensure_ascii=False))

with open('countries.geo.json') as response:
    counties = json.load(response)
df = pd.read_csv("datarand.csv",encoding="utf-8")

# 世界地图,不指定键值,默认采用geojson中的id值,即国家简写,数据表格中的列也要为国家简写,即country列
fig = px.choropleth_mapbox(df, geojson=counties,locations='country', color='key1',
                           color_continuous_scale=px.colors.diverging.RdYlGn[::-1],
                           range_color=(100, 10000),
                           mapbox_style="carto-positron",
                           zoom=1,
                           center="lat": 37.4189, "lon": 116.4219,
                           opacity=0.5
                          )
fig.update_layout(margin="r":0,"t":0,"l":0,"b":0)
fig.show()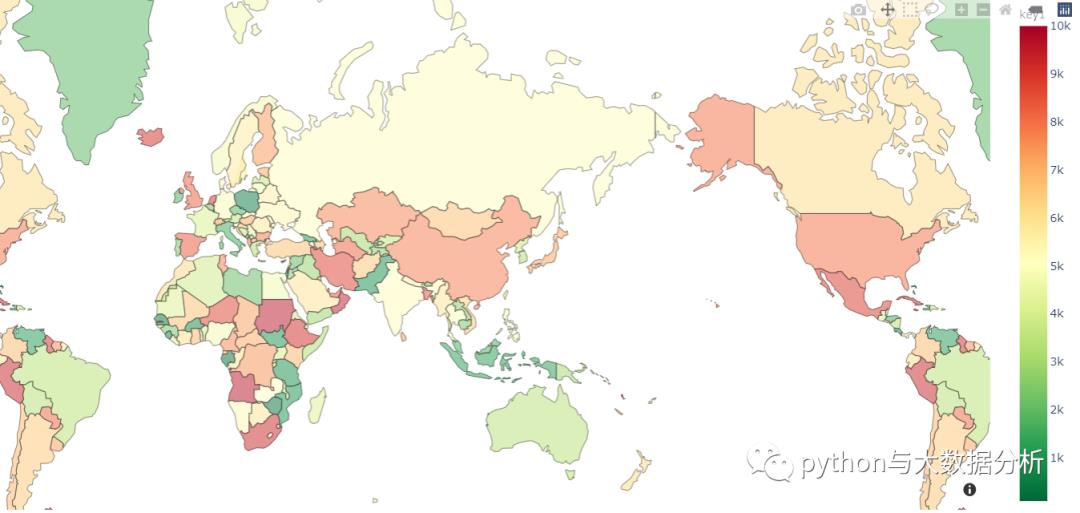
# 世界地图,指定properties.name国家名称作为键值,数据表格中的列也要改为国家,即locations列
fig = px.choropleth_mapbox(df, geojson=counties, featureidkey="properties.name",locations='name', color='key1',
                           color_continuous_scale="Viridis",
                           range_color=(100, 10000),
                           mapbox_style="carto-positron",
                           zoom=1,
                           center="lat": 37.4189, "lon": 116.4219,
                           opacity=0.5
                          )
fig.update_layout(margin="r":0,"t":0,"l":0,"b":0)
fig.show()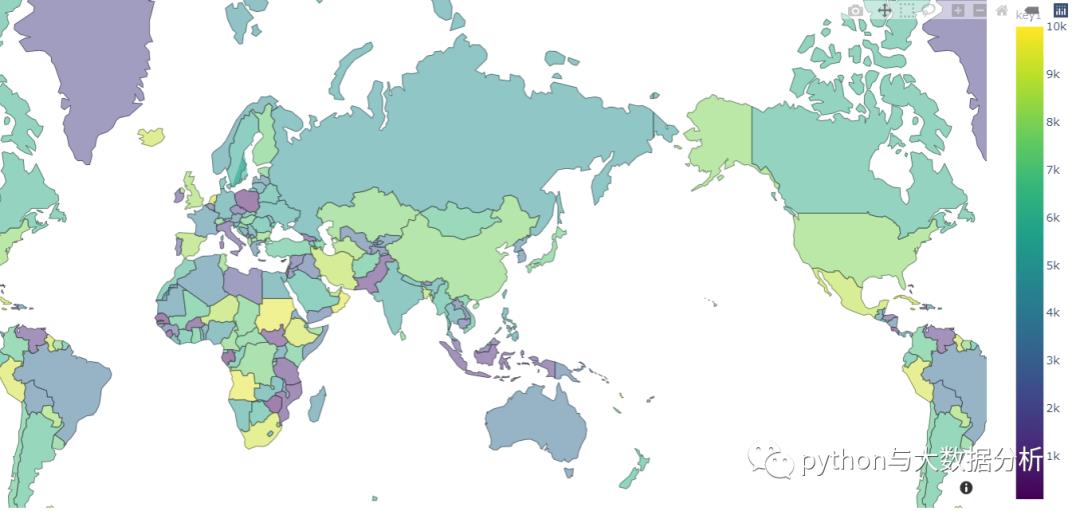
# 世界地图,指定id国家简写作为键值,数据表格中的列也要改为国家简写,即country列
fig = px.choropleth_mapbox(df, geojson=counties, featureidkey="id",locations='country', color='key1',
                           color_continuous_scale="Reds",
                           range_color=(100, 10000),
                           mapbox_style="carto-positron",
                           zoom=1,
                           center="lat": 37.4189, "lon": 116.4219,
                           opacity=0.5
                          )
fig.update_layout(margin="r":0,"t":0,"l":0,"b":0)
fig.show()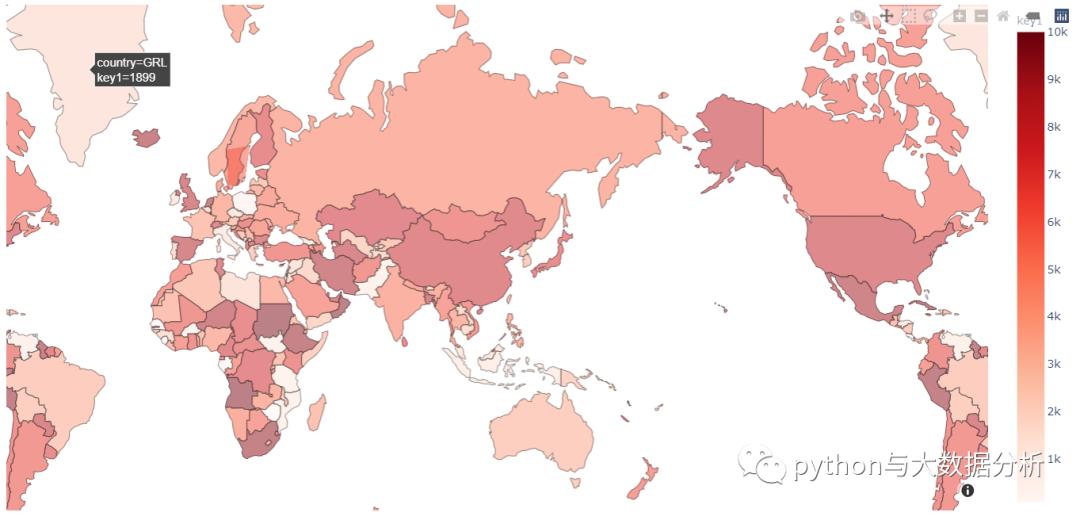
# 世界地图,不指定键值,默认采用geojson中的id值,即国家简写,数据表格中的列也要为国家简写,即country列,对color_continuous_scale进行设置
fig = px.choropleth_mapbox(df, geojson=counties, locations='country',  color='key1',
                           range_color=(100, 10000),
                           color_continuous_scale=[
                               [0, 'lightcoral'],  # 这个必须要写,否则会出错
                               [1. / 3000, 'indianred'],
                               [1. / 300, 'brown'],
                               [1. / 30, 'firebrick'],
                               [1 / 3, 'maroon'],
                               [1., 'darkred']],
                           zoom=1,
                           center="lat": 37.4189, "lon": 116.4219,
                           mapbox_style='carto-positron')

fig.update_layout(margin="r": 0, "t": 0, "l": 0, "b": 0)
fig.show()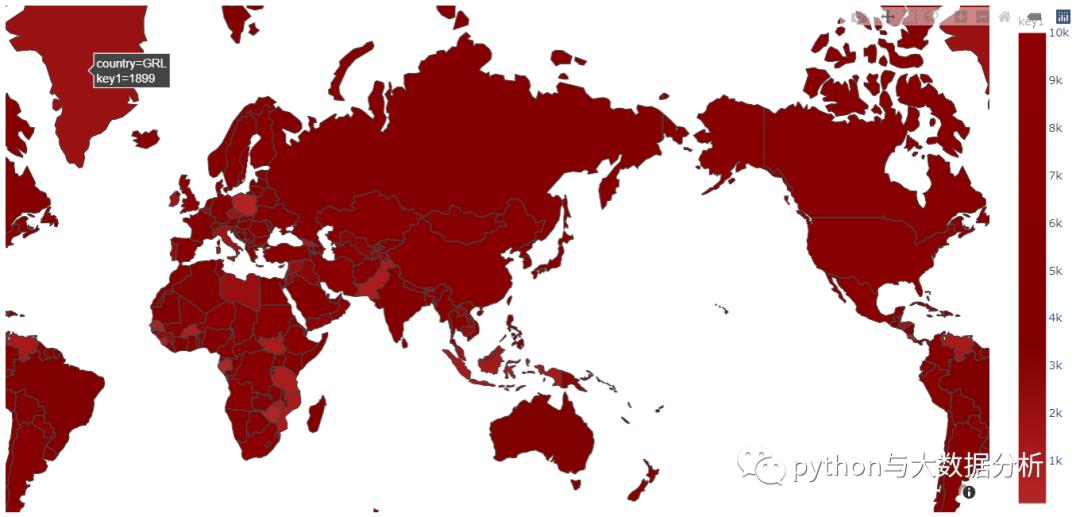
# 中国地图
with open('china_geo.json') as response:
    counties = json.load(response)

df = pd.read_csv("data.csv",encoding="utf-8",
                   dtype="areacode": str)

fig = px.choropleth_mapbox(df, geojson=counties, featureidkey="properties.adcode",locations='areacode',  color='confirm',
                           #color_continuous_scale="Viridis",
                           range_color=(1, 80000),
                           color_continuous_scale=[
                               [0, 'lightcoral'],  # 这个必须要写,否则会出错
                               [1. / 3000, 'indianred'],
                               [1. / 300, 'brown'],
                               [1. / 30, 'firebrick'],
                               [1 / 3, 'maroon'],
                               [1., 'darkred']],
                           zoom=3, center="lat": 37.4189, "lon": 116.4219,
                           mapbox_style='carto-positron')

fig.update_layout(margin="r": 0, "t": 0, "l": 0, "b": 0)
fig.show()

# 海南地图
with open('460000-hainan.json') as response:
    counties = json.load(response)

df = pd.read_csv("hainandata.csv",encoding="utf-8",
                   dtype="areacode": str)


fig = px.choropleth_mapbox(df, geojson=counties, featureidkey="properties.adcode",locations='areacode',  color='confirm',
                           # color_continuous_scale="Geyser",
                           color_continuous_scale='Reds',
                           #color_continuous_scale=px.colors.diverging.RdYlGn[::-1],
                           range_color=(1, 1500),
                           zoom=6, center="lat": 20.031971, "lon": 110.33119,
                           mapbox_style='carto-positron')

fig.update_layout(margin="r": 0, "t": 0, "l": 0, "b": 0)
fig.show()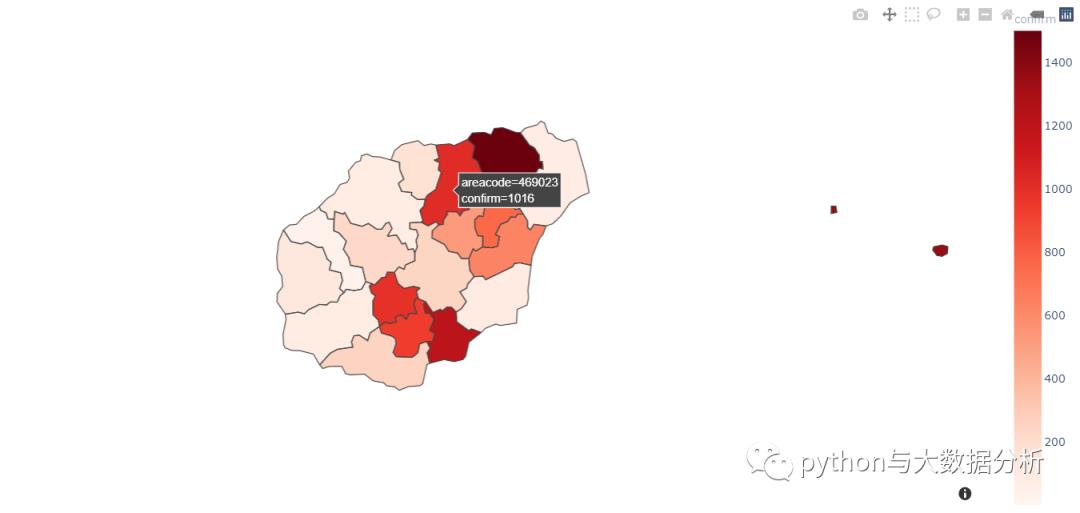
最后请多多关注,谢谢!

以上是关于关于Python可视化Dash工具—choropleth_mapbox地图实现的主要内容,如果未能解决你的问题,请参考以下文章