Vue使用Echarts展示地图
Posted CapPengCheng&
tags:
篇首语:本文由小常识网(cha138.com)小编为大家整理,主要介绍了Vue使用Echarts展示地图相关的知识,希望对你有一定的参考价值。
Vue使用Echarts展示地图
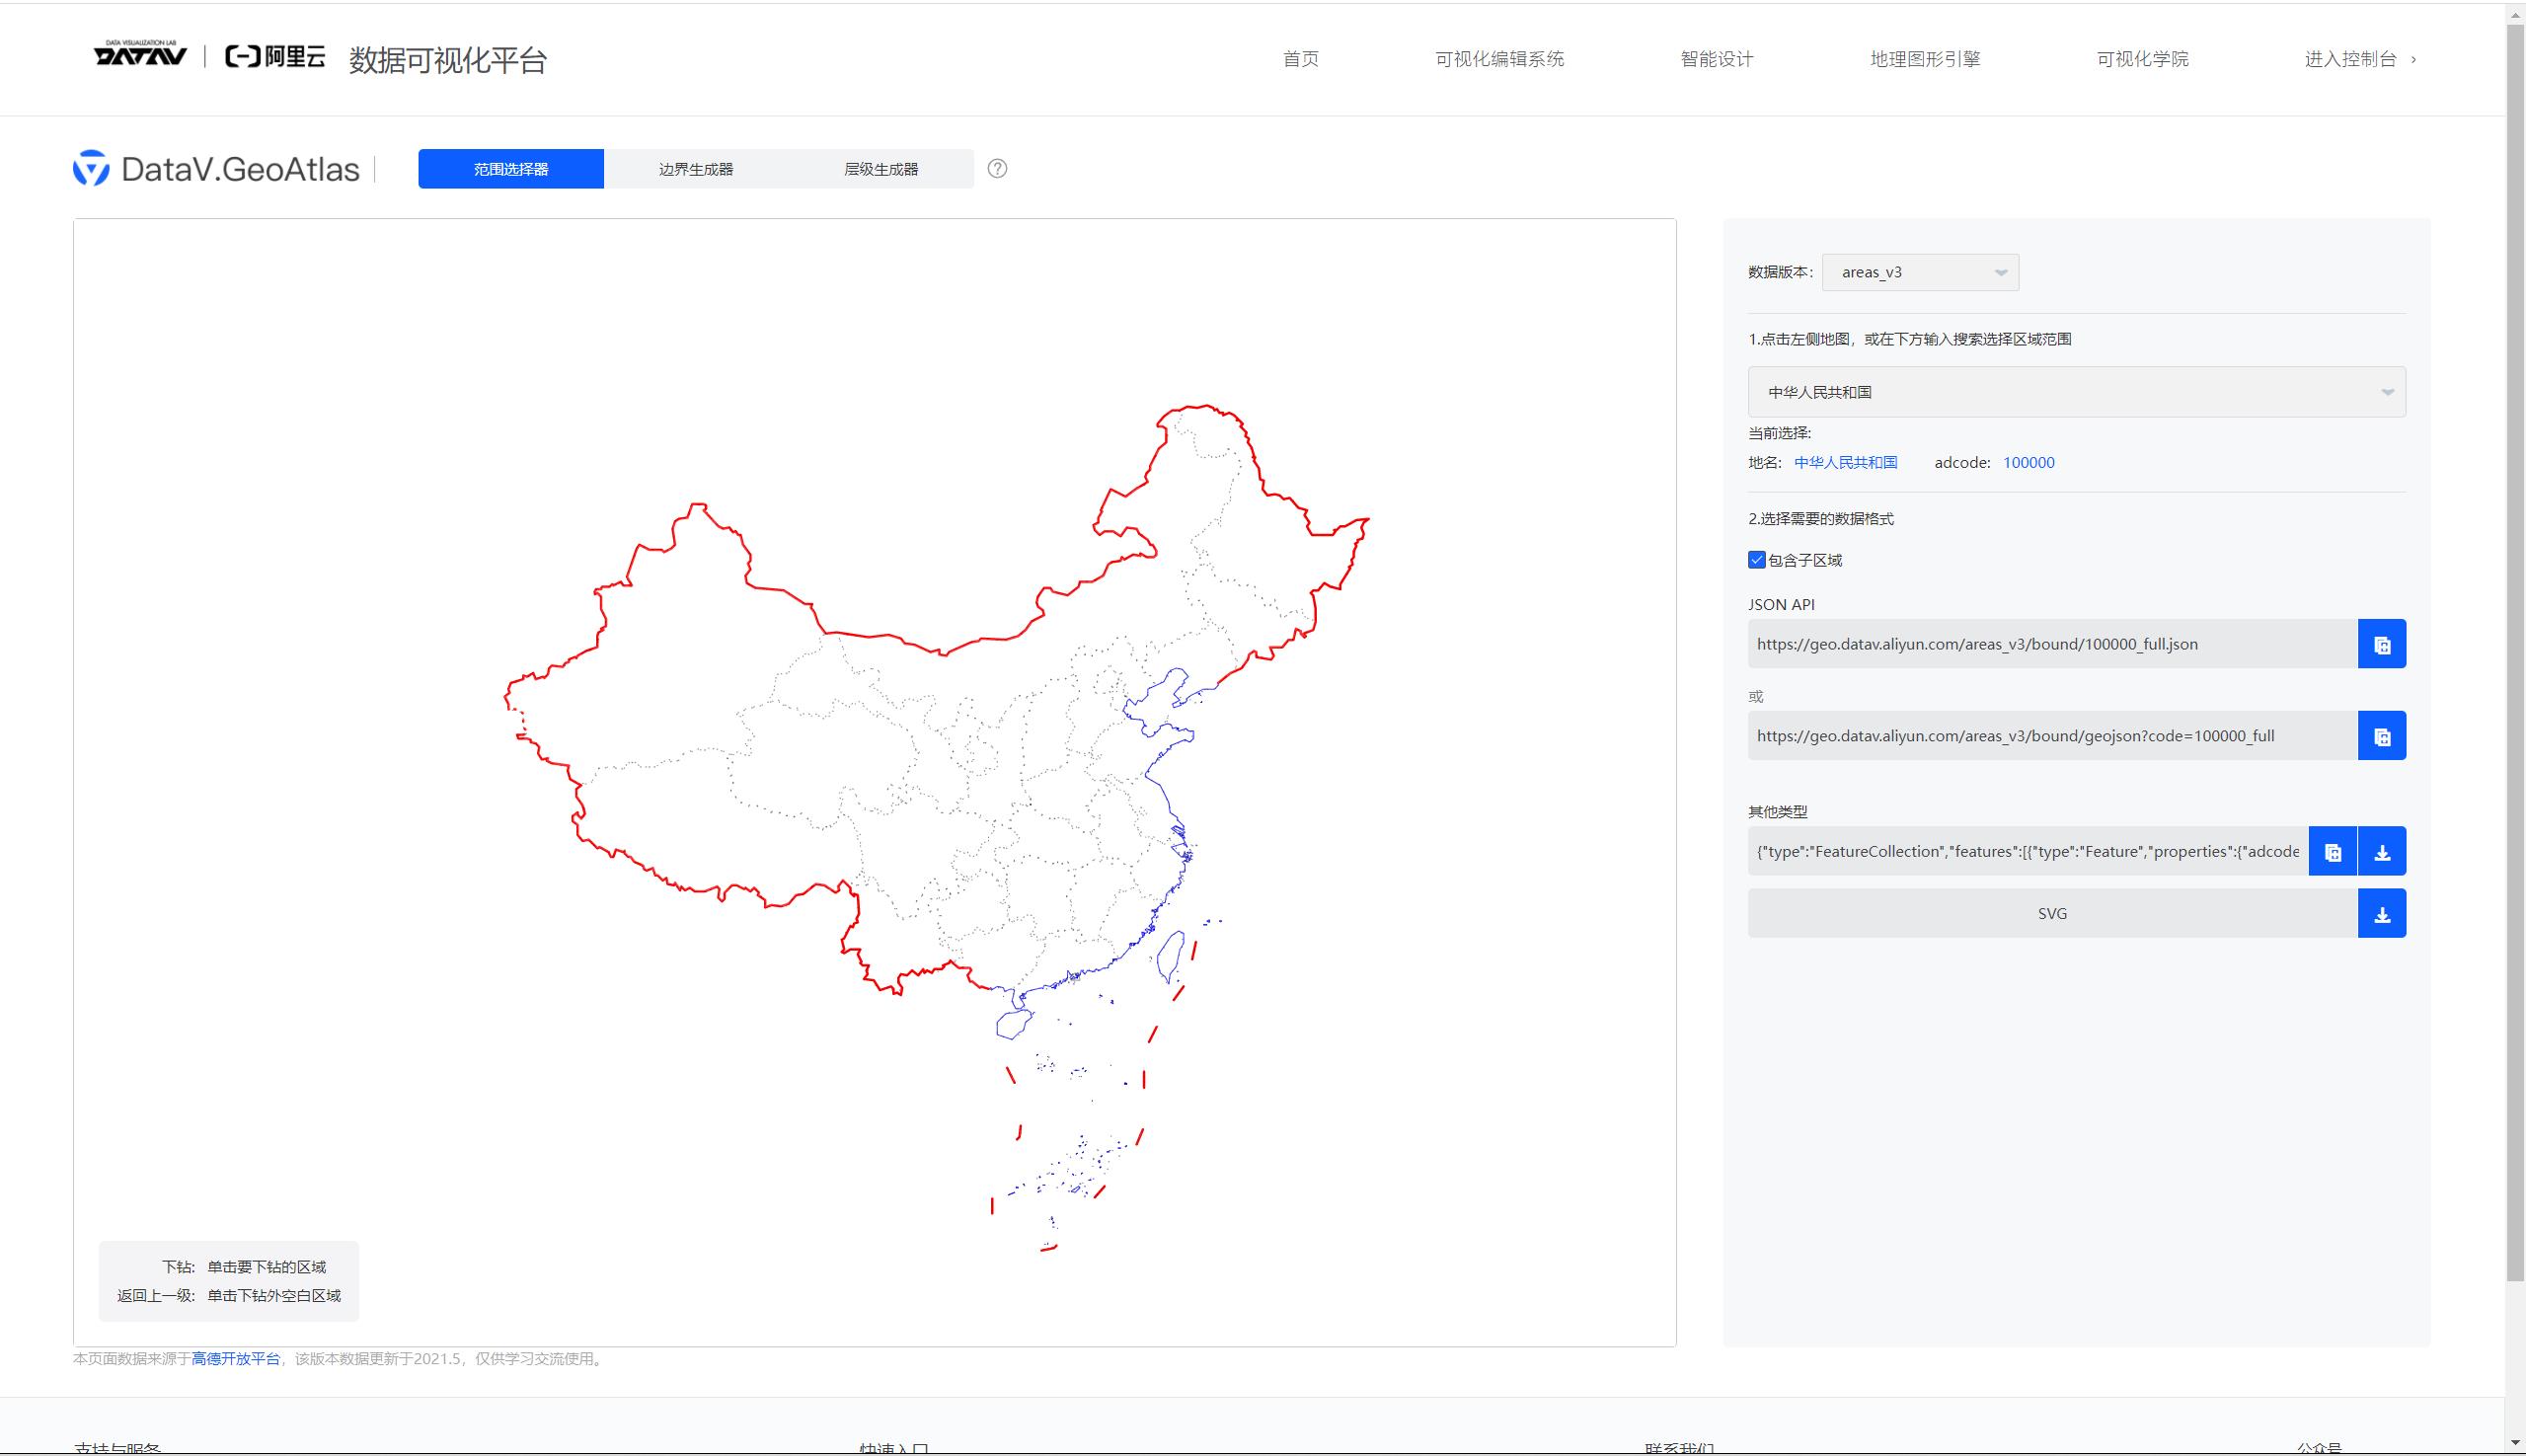
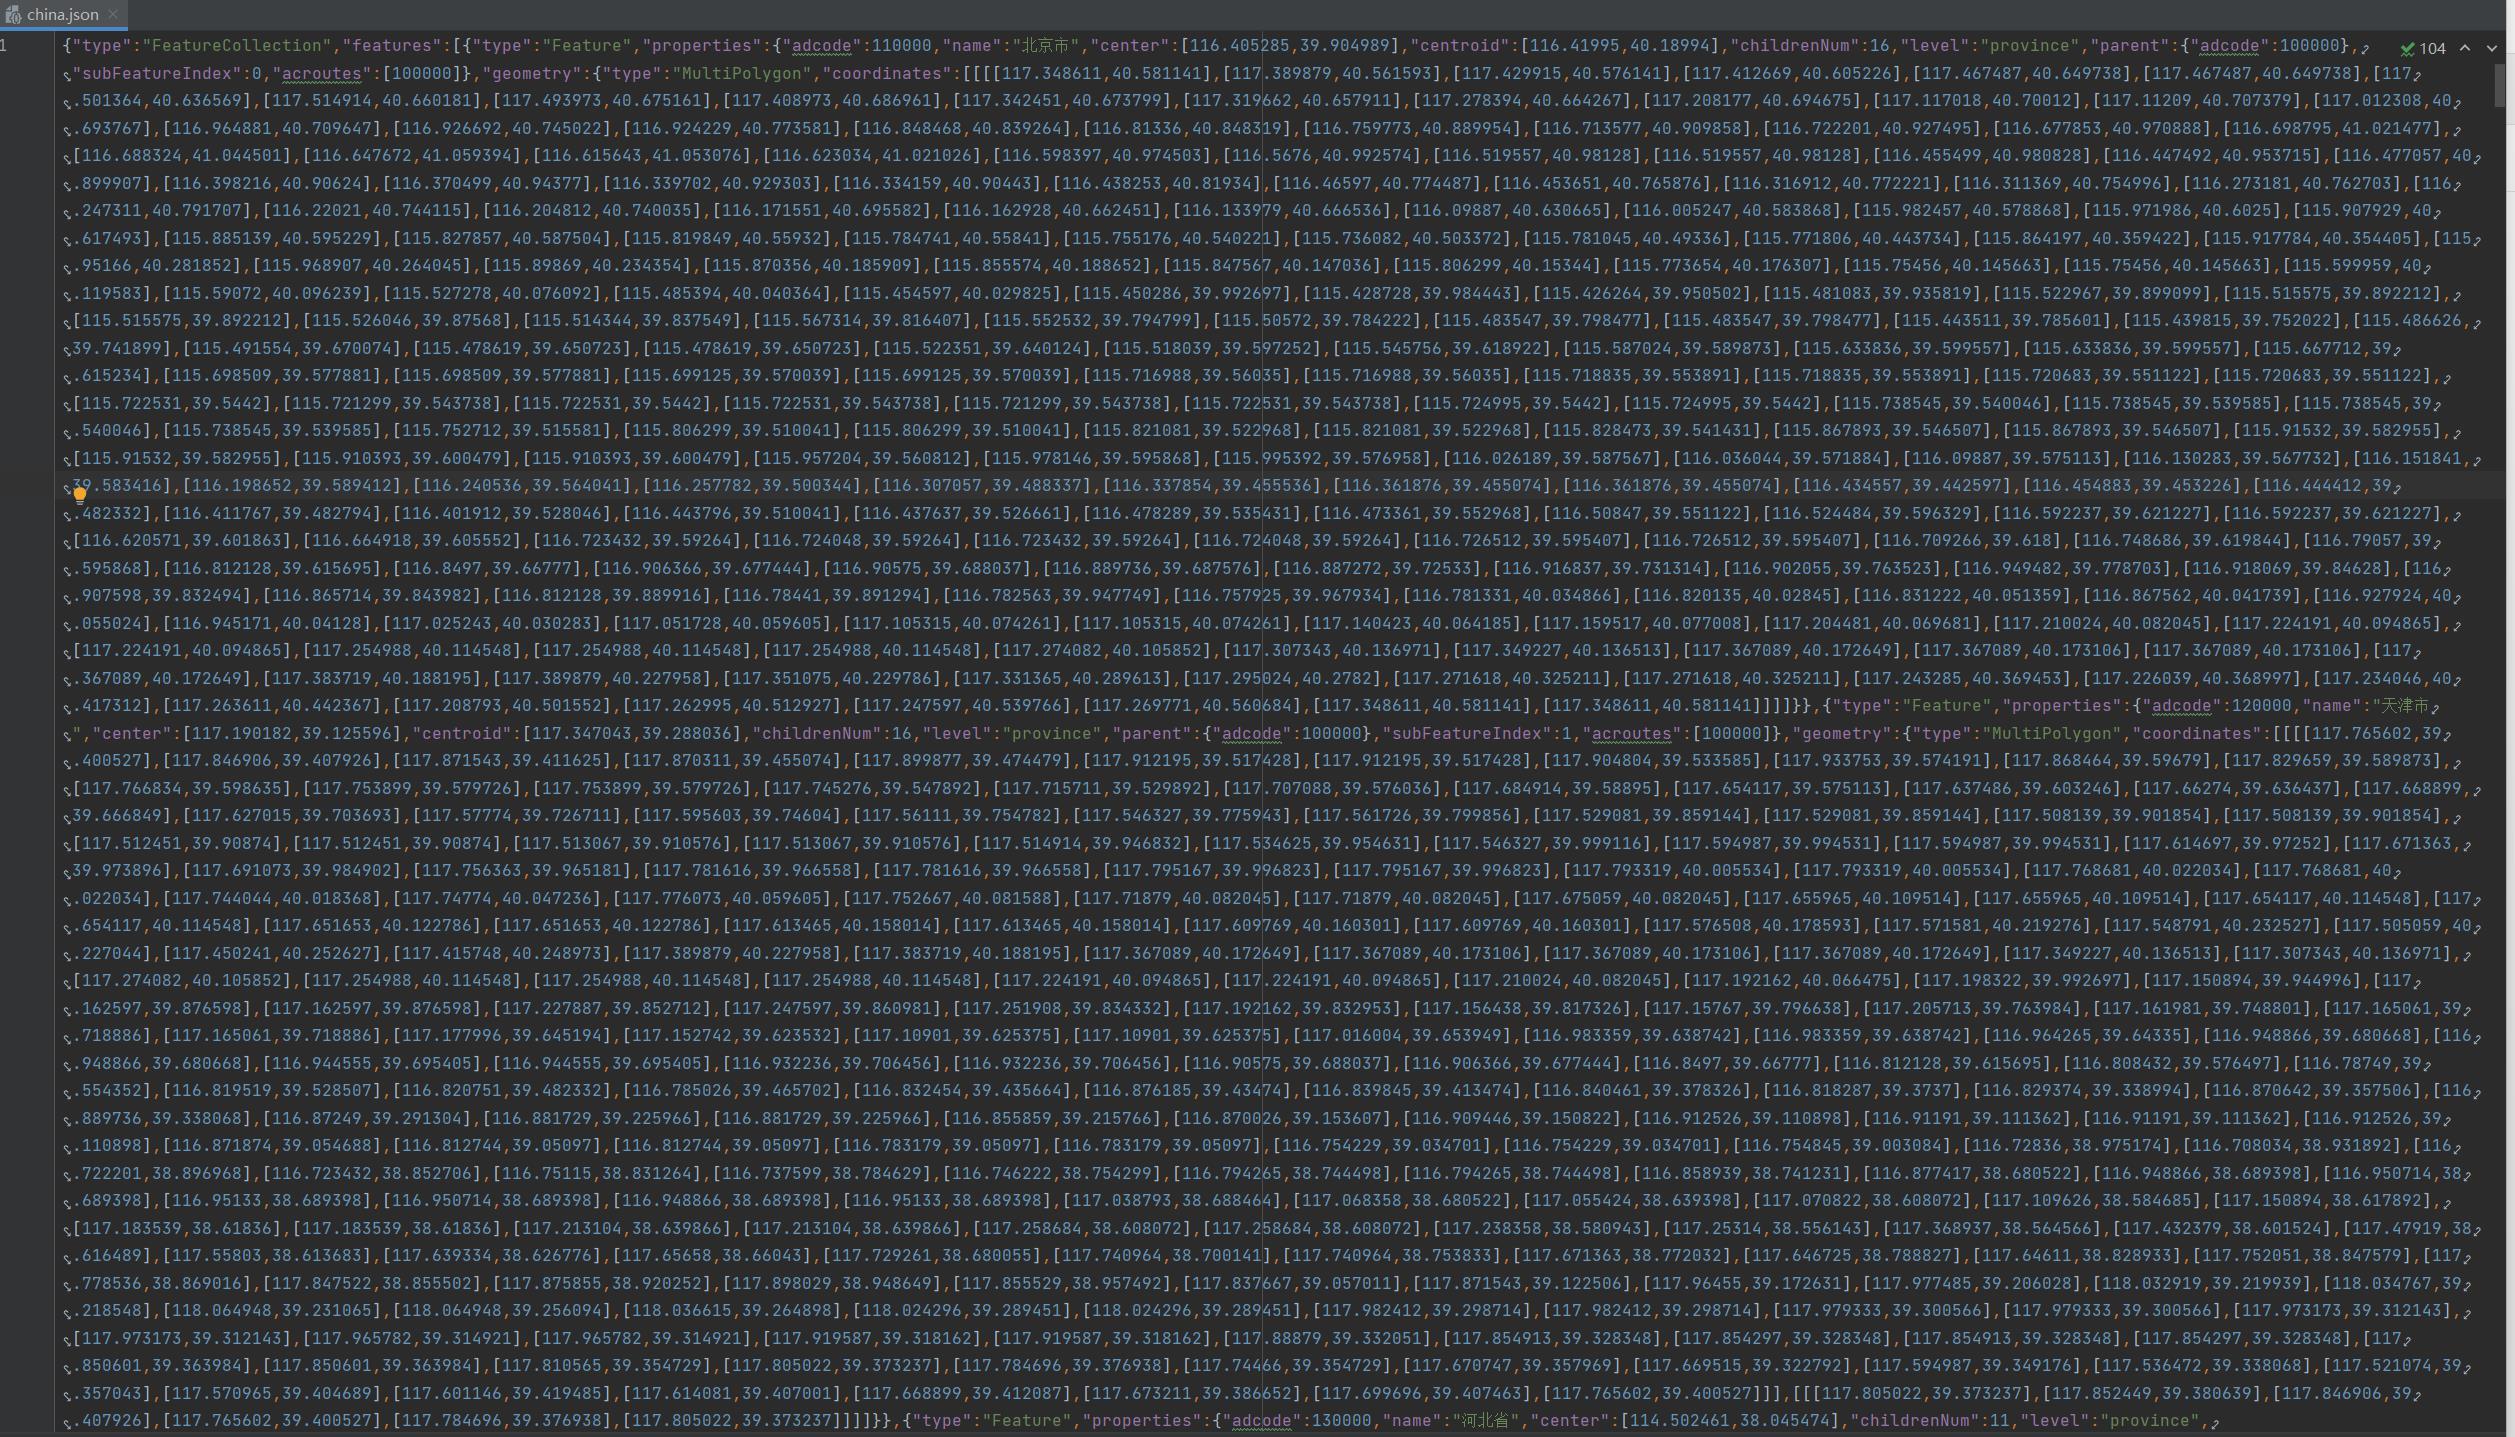
一,获取地图json
阿里云数据可视化平台获取
阿里云DataV地图选择器


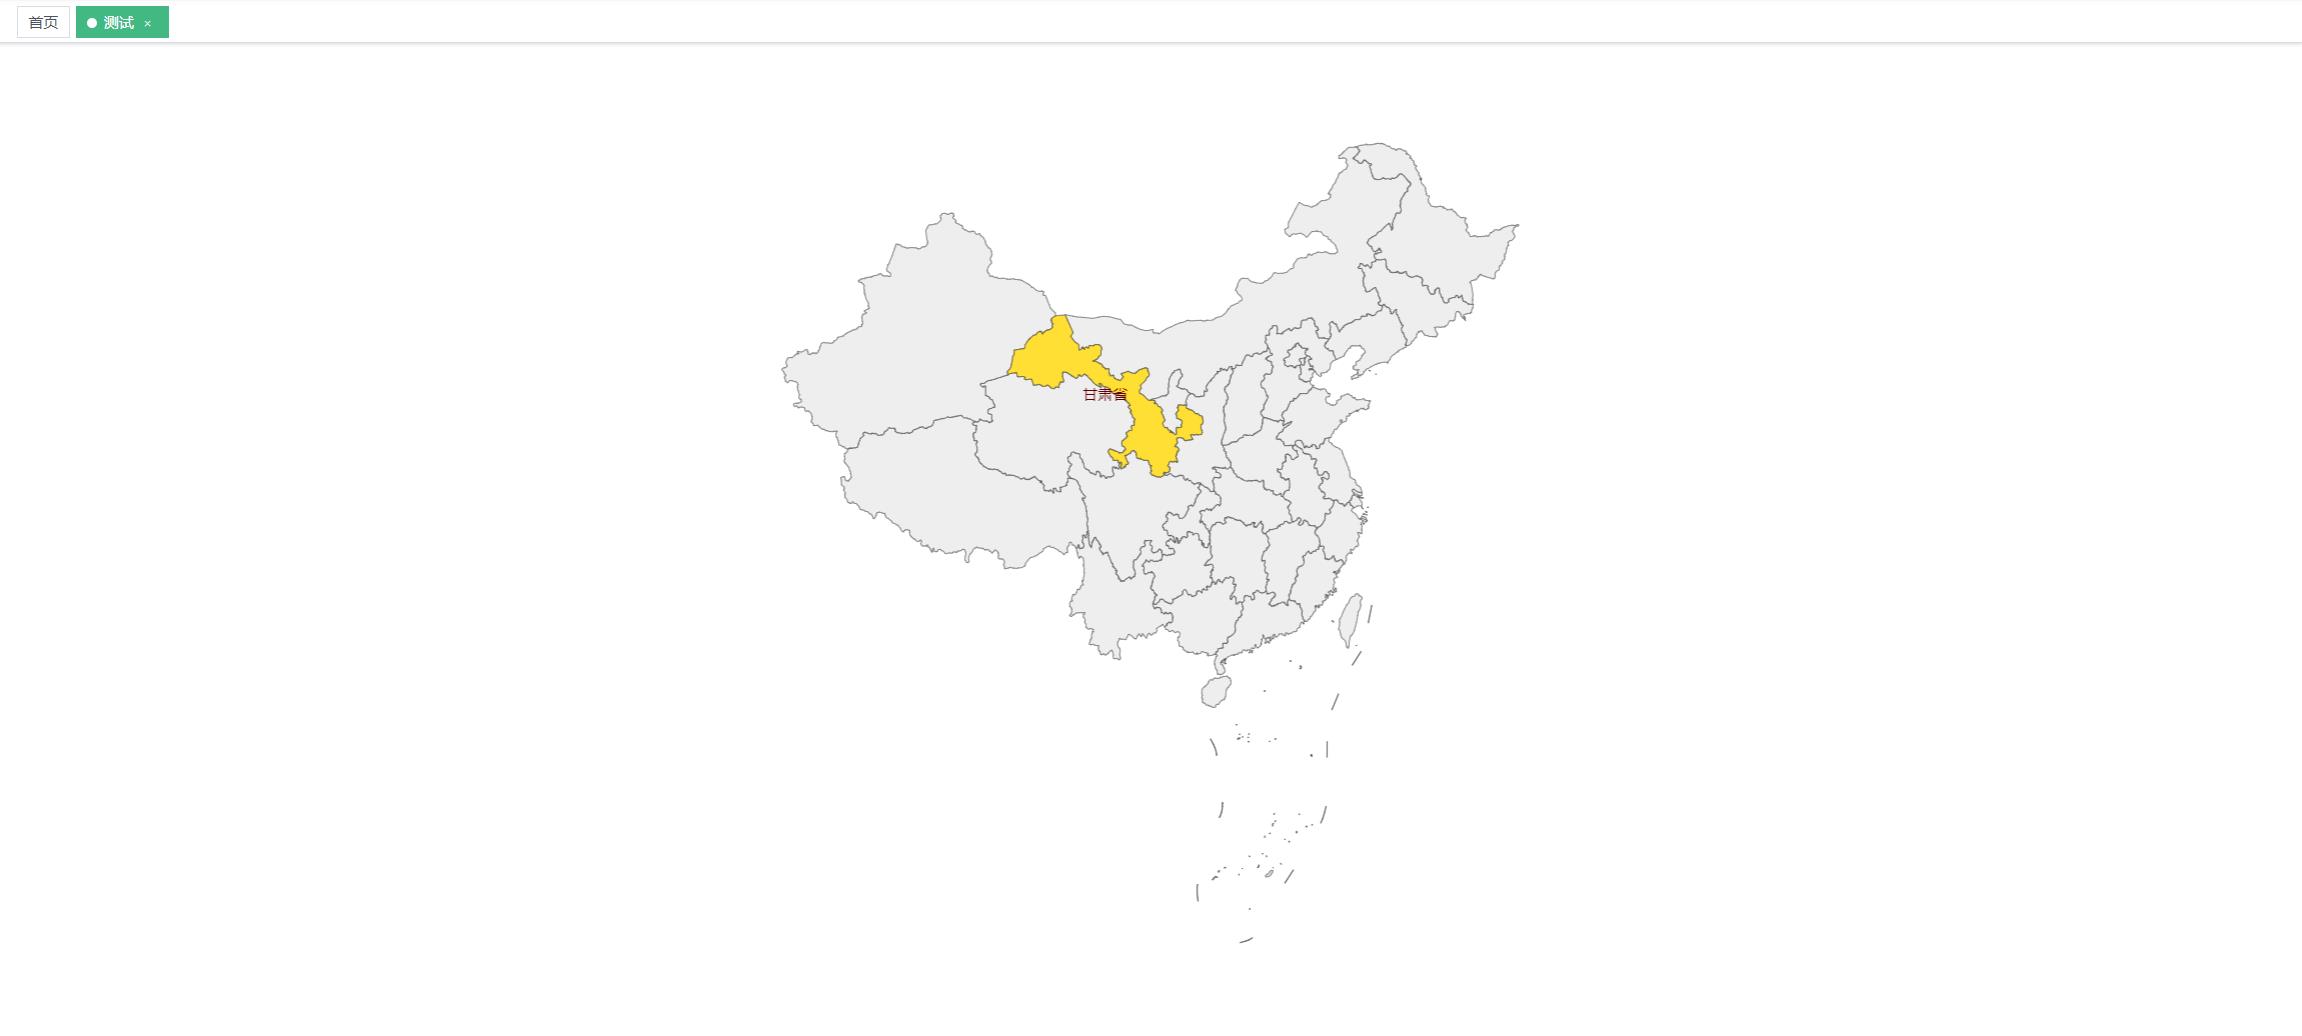
二,Vue实现展示
2.1 Vue环境
ES6、vue、vuex、vue-router、vue-cli、axios、element-ui
Node >= 10
2.2 main.js引入Echarts
// 引入Echarts
import echarts from 'echarts'
Vue.prototype.$echarts = echarts
2.3 展示
<template>
  <div id="main" style="width: 100%;height:800px;" />
</template>
<script>

import echarts from 'echarts'
import JSON from '@/map/china.json'

export default
  mounted()
    this.leftCenterMap()
  ,
  methods:
    leftCenterMap()
      var myChart = echarts.init(document.getElementById('main')) // 拿到一个实例
      echarts.registerMap('中国', JSON, )// 引入地图文件
      console.log(JSON)
      var option =
        series: [

            type: 'map',
            mapType: '中国'// 地图名称
          ]

      myChart.setOption(option)


</script>

以上是关于Vue使用Echarts展示地图的主要内容,如果未能解决你的问题,请参考以下文章