Elastic Stack 环境配置与框架简介
Posted 17岁boy想当攻城狮
tags:
篇首语:本文由小常识网(cha138.com)小编为大家整理,主要介绍了Elastic Stack 环境配置与框架简介相关的知识,希望对你有一定的参考价值。
目录
简介
什么是Elastic Stack
Elastic Stack缩写为elk,它由三个软件组成:Elasticsearch、Logstash、Kibana,因此缩写为elk,随着版本的变化,添加了一个新软件Beats,因此其全名现在为ELKB
Elasticasearch
Elasticasearch是一个基于java的开源分布式搜索引擎。其特点如下:
- 分布式
- 无需配置
- 自动发现
- 索引复制机制
- Restful风格界面
- 多个数据源
- 自动搜索加载
Elasticasearch为所有类型的数据提供近乎实时的搜索和分析。无论您拥有结构化或非结构化文本、数字数据或地理空间数据,Elasticsearch都可以以支持快速搜索的方式高效地存储和索引。
Logstash
Logstash是一个轻量级的日志收集系统。它以管道的形式工作。它可以过滤从管道输入的数据,并在输出时将结果传输到任何服务器
Kibana
Kibana是Elasticsearch的可视化服务。它可以直观地显示Elasticsearch生成的数据,并支持多样化的分析和演示
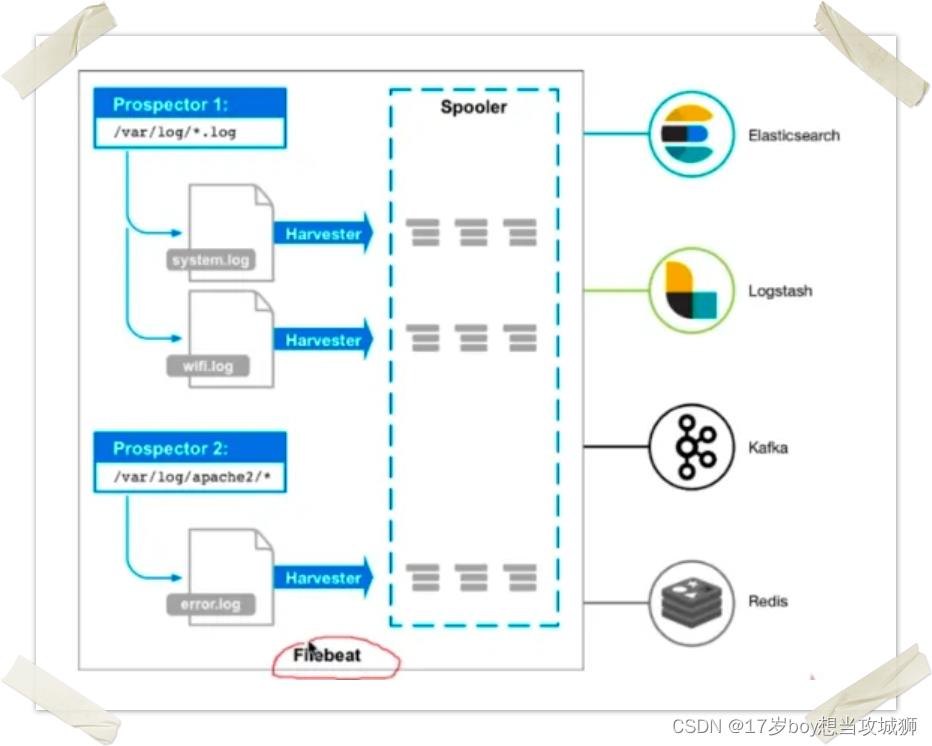
Beats
Beats是Elastic开发的客户端程序,用于存储在监控服务器中。它主要用于数据收集,可以将收集的数据发送到Elasticsearch或Logstash
框架图
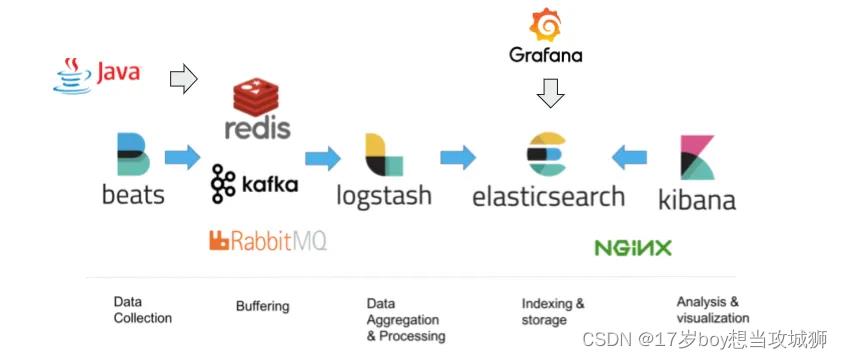
Beats(FileBeats)
Beats->Logstash->Elasticsearch->Kibana
下载
本文中使用的beats功能:filebeat
| Name | Link | |
|---|---|---|
| 1 | Elasticasearch | download |
| 2 | Logstash | download |
| 3 | Kibana | download |
| 4 | beats | download |
配置
一、安装java环境
- 安装JDK
sudo apt-get install openjdk-8-jdk- 检查Java
$ java -version
openjdk version "1.8.0_352"
OpenJDK Runtime Environment (build 1.8.0_352-8u352-ga-1~22.04-b08)
OpenJDK 64-Bit Server VM (build 25.352-b08, mixed mode)- 关闭防火墙
sudo ufw disable启动
Elasticsearch
打开配置文件
vim config/elasticsearch.yml打开以下两个字段并设置网络。主机设置为0.0.0.0,以便Internet可以访问此计算机
# ---------------------------------- Network -----------------------------------
#
# By default Elasticsearch is only accessible on localhost. Set a different
# address here to expose this node on the network:
#
network.host: 0.0.0.0
#
# By default Elasticsearch listens for HTTP traffic on the first free port it
# finds starting at 9200. Set a specific HTTP port here:
#
http.port: 9200
关闭GeoIp采集
ingest.geoip.downloader.enabled: false关闭SSH身份验证。你可以检查自己的情况。如果您在没有证书的情况下通过HTTPS访问浏览器,将被阻止
xpack.security.enabled: false
xpack.security.http.ssl:
  enabled: false
  keystore.path: certs/http.p12
添加跨域访问
http.cors.enabled: true
http.cors.allow-origin: "*"
修改jvm虚拟机的映射内存以提高文件处理速度
vim config/jvm.options修改如下:
如果使用Java 19,可以添加--enable-preview参数来改进MMapDirectory
################################################################
## IMPORTANT: JVM heap size
################################################################
##
## The heap size is automatically configured by Elasticsearch
## based on the available memory in your system and the roles
## each node is configured to fulfill. If specifying heap is
## required, it should be done through a file in jvm.options.d,
## which should be named with .options suffix, and the min and
## max should be set to the same value. For example, to set the
## heap to 4 GB, create a new file in the jvm.options.d
## directory containing these lines:
##
-Xms4g
-Xmx4g
##
## See https://www.elastic.co/guide/en/elasticsearch/reference/8.5/heap-size.html
## for more information
##
################################################################
修改虚拟MAP大小
sudo vim /etc/sysctl.conf将此内容添加到文件并保存
vm.max_map_count=262144重置sysctl
sysctl -p启动
./bin/elasticsearch在浏览器中打开以下地址,并将IP更改为服务器的IP(非环回地址)
http://x.x.x.x:9200/如果成功,浏览器将返回以下输出:
  "name" : "xxxx",
  "cluster_name" : "elasticsearch",
  "cluster_uuid" : "mkUeEpucQEWlPVQpJXwOjw",
  "version" :
    "number" : "8.5.2",
    "build_flavor" : "default",
    "build_type" : "tar",
    "build_hash" : "a846182fa16b4ebfcc89aa3c11a11fd5adf3de04",
    "build_date" : "2022-11-17T18:56:17.538630285Z",
    "build_snapshot" : false,
    "lucene_version" : "9.4.1",
    "minimum_wire_compatibility_version" : "7.17.0",
    "minimum_index_compatibility_version" : "7.0.0"
  ,
  "tagline" : "You Know, for Search"
Kibana
配置端口和地址。使用0.0.0.0作为通用地址
vim config/kibana.yaml添加以下内容:
# =================== System: Kibana Server ===================
# Kibana is served by a back end server. This setting specifies the port to use.
server.port: 5601

# Specifies the address to which the Kibana server will bind. IP addresses and host names are both valid values.
# The default is 'localhost', which usually means remote machines will not be able to connect.
# To allow connections from remote users, set this parameter to a non-loopback address.
server.host: "0.0.0.0"
启动
./bin/kinaba通过浏览器访问以下地址:
http://x.x.x.x:5601/如果启动正常,你可以看到以下页面:

FileBeat
首先,创建测试日志文件并输入测试内容:
touch test.log
echo test message > test.log
打开filebeat。yml并修改以下内容
测验log是刚刚创建的文件,你可以根据你的要求更改:
# filestream is an input for collecting log messages from files.
- type: filestream

  # Unique ID among all inputs, an ID is required.
  id: my-filestream-id

  # Change to true to enable this input configuration.
  enabled: true

  # Paths that should be crawled and fetched. Glob based paths.
  paths:
    - /home/logserver_bzm/test.log
屏蔽elastic search输出
#output.elasticsearch:
  # Array of hosts to connect to.
  #  hosts: ["localhost:9200"]
打开logstash
output.logstash:
  # The Logstash hosts
  hosts: ["localhost:5044"]
启动
./filebeat -e -c filebeat.yml -d "publish"Logstash
首先创建一个配置文件来配置logstash
vim ./config/logstash.conf写下以下内容
"logstash的简单配置。输入部分用于配置filebeat,过滤部分用于设置过滤屏幕以过滤filebeat的输入,输出部分将消息发送到弹性搜索"
input
        beats
                port => 5044
                codec => "json"


filter
grok
match =>  "message" => "(?<text>(.*))"


output
        stdout  codec => rubydebug
        elasticsearch
                        hosts => ["localhost:9200"]
                        index => "test1-nginx-access-%+YYYY.MM.dd"
启动
./bin/logstash -f ./config/logstash.conf测验
完成所有配置并启动四项服务后,在浏览器中输入Kibana的地址
在打开的页面中选择菜单图标
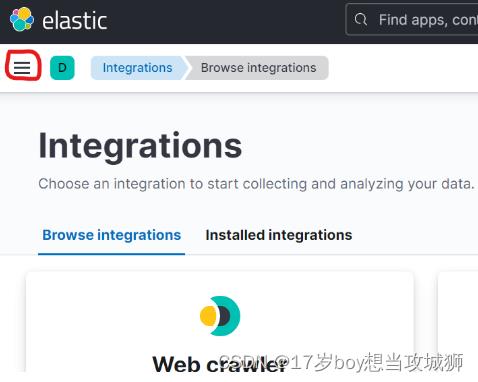
下拉并找到“Dev Tools”

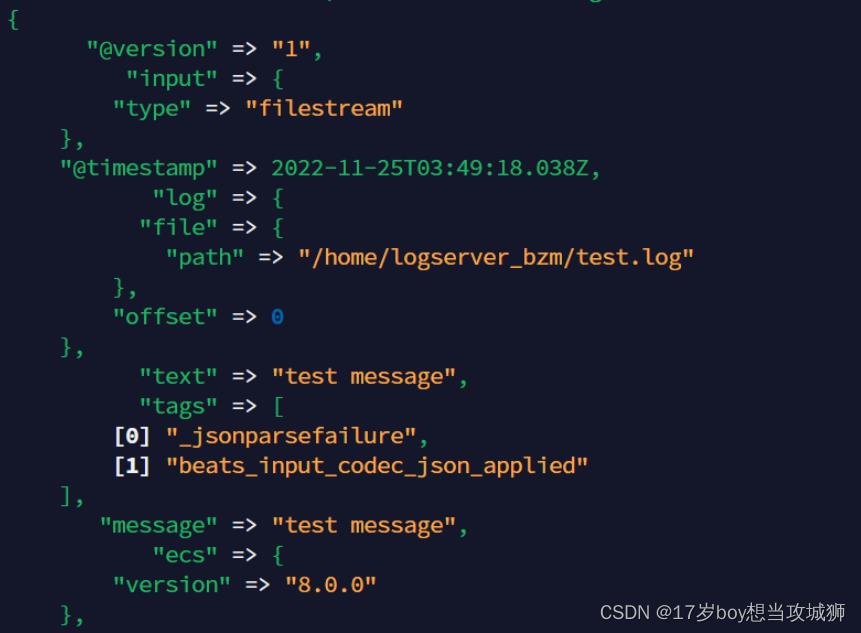
运行控制台代码。如果一切正常,你可以看到以下输出:

可以从输出中看到你在filebeat里配置的日志文件里的内容
  "took": 58,
  "timed_out": false,
  "_shards":
    "total": 1,
    "successful": 1,
    "skipped": 0,
    "failed": 0
  ,
  "hits":
    "total":
      "value": 1,
      "relation": "eq"
    ,
    "max_score": 1,
    "hits": [

        "_index": "test1-nginx-access-2022.11.25",
        "_id": "P93orIQBWUNz5yg551ec",
        "_score": 1,
        "_source":
          "@version": "1",
          "input":
            "type": "filestream"
          ,
          "@timestamp": "2022-11-25T03:49:18.038Z",
          "log":
            "file":
              "path": "/home/logserver_bzm/test.log"
            ,
            "offset": 0
          ,
          "text": "test message",
          "tags": [
            "_jsonparsefailure",
            "beats_input_codec_json_applied"
          ],
          "message": "test message",
          "ecs":
            "version": "8.0.0"


    ]
很明显,输出中的消息部分与日志中的内容一致
你还可以看到logstash的输出
以上是关于Elastic Stack 环境配置与框架简介的主要内容,如果未能解决你的问题,请参考以下文章