利用hive,怎么统计每个页面的访问时间
Posted
tags:
篇首语:本文由小常识网(cha138.com)小编为大家整理,主要介绍了利用hive,怎么统计每个页面的访问时间相关的知识,希望对你有一定的参考价值。
参考技术A select url ,sum(time) from log group by url学习笔记--HIVE网站日志统计分析
前言
本次实践的目的是结合之前所学flume、hadoop、hive几个主要技术,完成一个小案例。
目标:
统计出独立ip数量
统计一个ip使用的header数量
访问最多的url链接 每个ip常访问的url
单日每小时访问量折线图
准备
安装并配置好flume、hadoop、hive
hive安装配置
hadoop安装配置
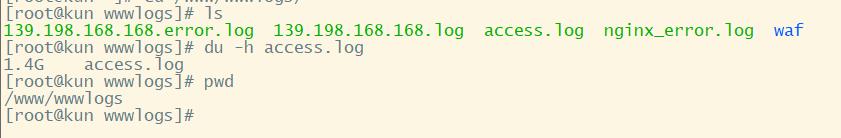
数据源 nginx日志文件access.log
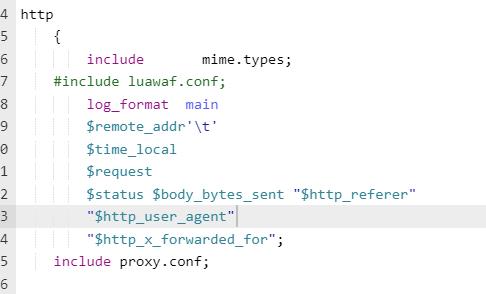
需修改nginx日志输出格式
满足如下格式,可减免数据清洗步骤
10.88.122.105  09:15:04  GET /js/pagination.js HTTP/1.1
304 0 "http://10.88.105.20:8063/stockrecommand.html" "Mozilla/4.0 (compatible; MSIE 7.0; Windows NT 6.1; WOW64; Trident/7.0; SLCC2; .NET CLR 2.0.50727; .NET CLR 3.5.30729; .NET CLR 3.0.30729; Media Center PC 6.0; .NET4.0C; .NET4.0E)"
准备一台服务器运行web服务,使用nginx做代理,使用flume采集nginx生产的日志上传至hdfs;
修改hdfs默认配置
因为我的网站每天只产生很少的数据量远小于hdfs默认的(128M)块大小因此为避免空间浪费需修改默认块大小
#修改默认块大小
<property>
	<name>dfs.blocksize</name>
	<value>10240000</value>
</propery>
#修改检查块大小 满足块大小整除检查块大小
<property>
	<name>dfs.bytes-per-checksum</name>
	<value>512</value>
</property>
yran资源管理器配置
在用hive操作时使用的内存会大于默认分配的资源因此需修改
#使用物理内存大小
  <property>
     <name>yarn.nodemanager.resource.memory-mb</name>
     <value>2048</value>
  </property>
  <property>
     <name>yarn.scheduler.maximum-allocation-mb</name>
     <value>2048</value>
  </property>
flume采集方案
cd /export/servers/flume/conf/
#定义三大组件的名称
agent1.sources = source1
agent1.sinks = sink1
agent1.channels = channel1
agent1.sources.source1.type = exec
agent1.sources.source1.command = tail -F /www/wwwlogs/139.198.168.168.log
agent1.sources.source1.channels = channel1
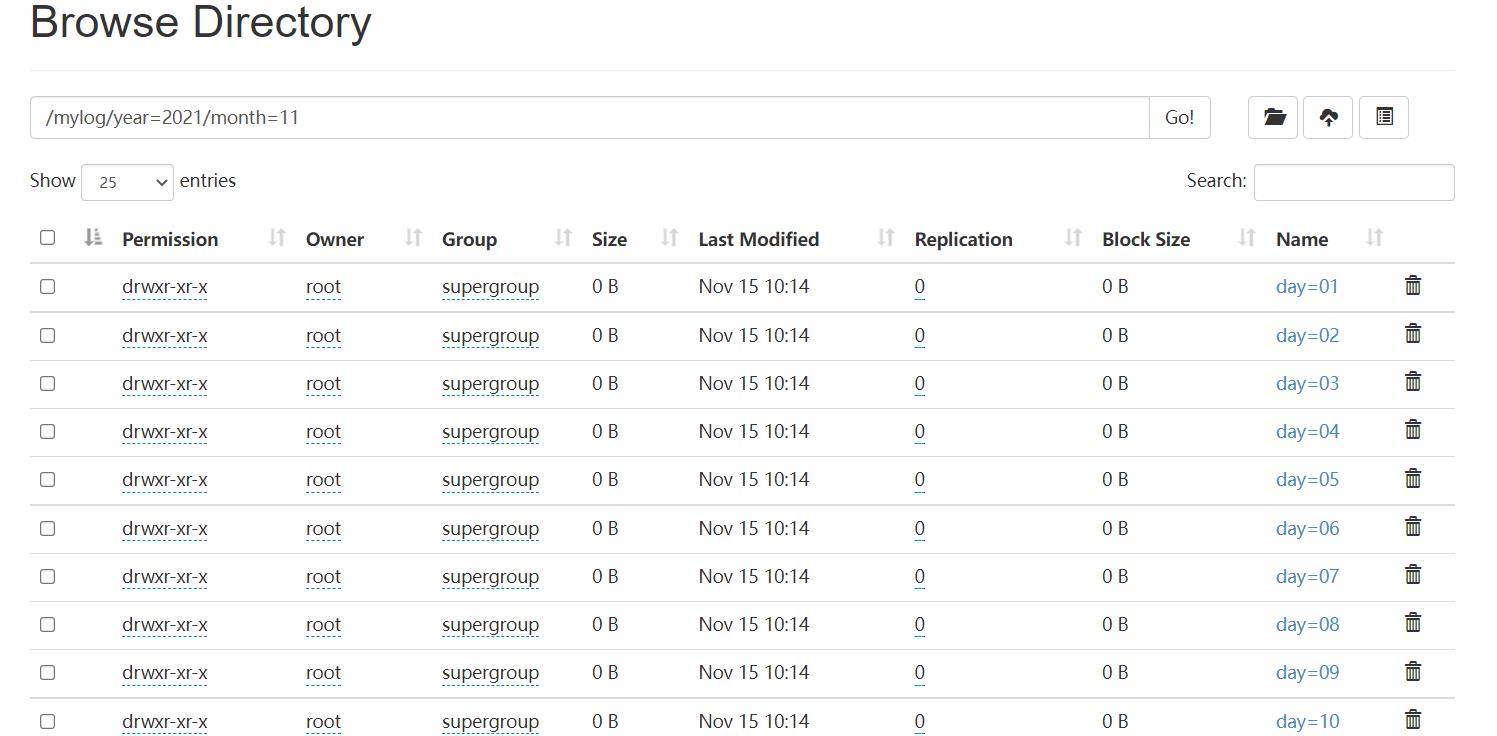
agent1.sinks.sink1.hdfs.path =hdfs://master:9000/weblog/year=20%y/month=%m/day=%d
agent1.sinks.sink1.hdfs.filePrefix = mylog
agent1.sinks.sink1.hdfs.fileType = DataStream
agent1.sinks.sink1.hdfs.writeFormat = Text
# 当文件滚动 生成新文件
# 配置文件滚动方式(文件大小10M) #8M
agent1.sinks.sink1.hdfs.rollSize = 8000000
agent1.sinks.sink1.hdfs.rollCount = 0
agent1.sinks.sink1.hdfs.rollInterval = 0
# 指的是正在写的hdfs文件多长时间不更新就关闭文件
agent1.sinks.sink1.hdfs.idleTimeout = 5
agent1.sinks.sink1.hdfs.minBlockReplicas = 1
# 向hdfs上刷新的event的个数
# 这三者之间的关系:batchsize <=transactionCapacity<=capacity
# 就是sink会一次从channel中取多少个event去发送,而这个发送是要最终以事务的形式去发送的
agent1.sinks.sink1.hdfs.batchSize = 10
# 我们打算对时间戳根据分钟以每10分钟为单位进行四舍五入。
# agent1.sinks.sink1.hdfs.round = true
# agent1.sinks.sink1.hdfs.roundValue = 24
# agent1.sinks.sink1.hdfs.roundUnit = hour
agent1.sinks.sink1.hdfs.useLocalTimeStamp = true
#使用通道在内存中缓冲事件
agent1.channels.channel1.type = memory
agent1.channels.channel1.keep-alive = 120
# capacity是指整个队列的缓存最大容量
agent1.channels.channel1.capacity = 1500
# transactionCapacity则是指事务event的最大容量,即每次传输的event最大为多少
agent1.channels.channel1.transactionCapacity = 100
#将源和接收器绑定到通道
agent1.sources.source1.channels = channel1
agent1.sinks.sink1.channel = channel1
agent1.sinks.sink1.type = hdfs
启动flume采集
#/bin/bash
#执行参数解析
nohup flume-ng agent --conf /export/servers/flume-1.9.0/conf --conf-file flume-spark-push.properties -name a1  >> /export/data/flume/loglisence.log &
#1、flume-ng  agent   运行一个Flume Agent
#2、--conf  指定配置文件路径
#3、--conf-file 收集方案文件
#4、-name  a1  Agent的名称 即上面的前缀 agent1
查看收集的记录
HIVE操作
首先在hive创建日志表,
create external table mlog(ip string,
mtime string,
url string,
respCode int,
header string)
partitioned by (year string,month string,day string)
row format delimited
fields terminated by '\\t';
location 'mylog/';
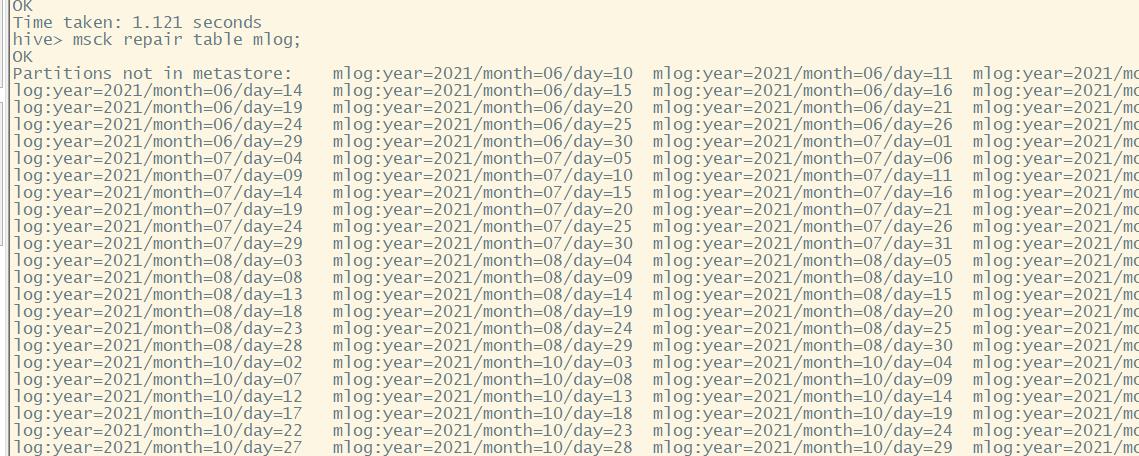
然后在hive shell commend repair一下mlog表;
msck repair table mlog;
将分区数据添加到metastore
数据查询
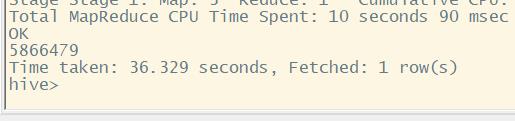
全部记录 5866479
select count(*) from log;
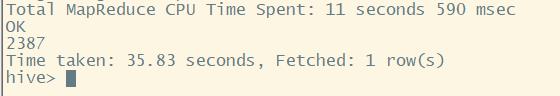
独立ip数量 2387
select count(distinct(ip)) from log;
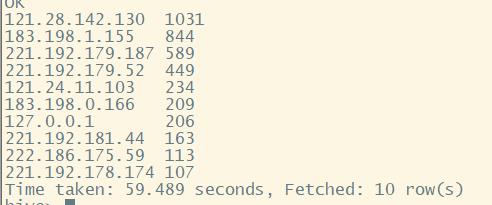
一个ip使用header数量
select ip,count(distinct(header)) c from log group by ip order by c desc;# limit 10;
访问最多的url
select url,count(url) c from log group by url order by c desc;

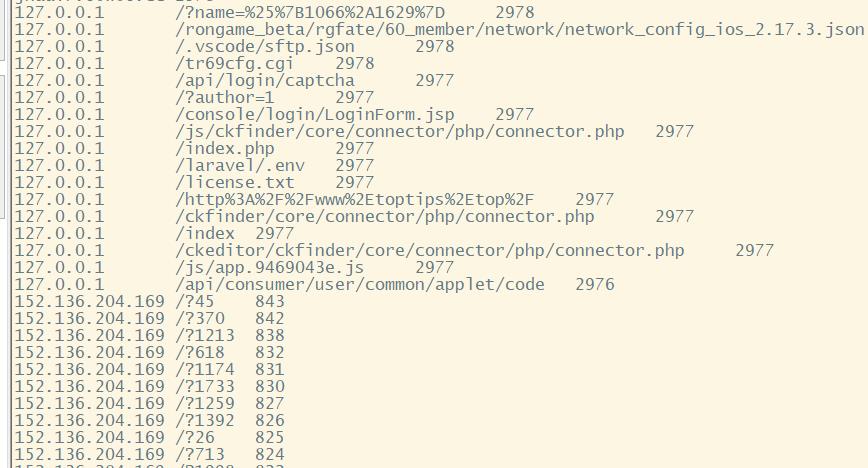
每个ip访问最多的url
select ip,url,count(url) c from log group by ip,url order by c desc; #limit 300;
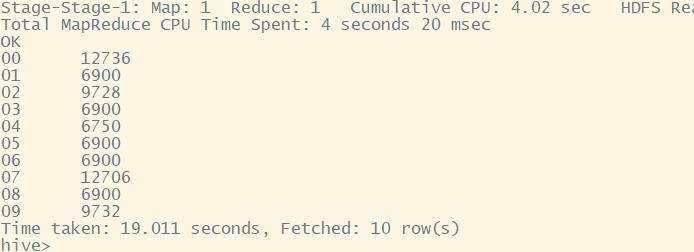
每小时访问量 指定分区
#不区分ip
select substring(mtime,0,2),count(*) from log where year='2021' and month='11' and day='07' group by substring(mtime,0,2) limit 10;
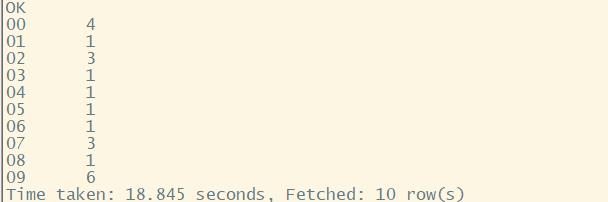
#每小时独立ip访问量
select substring(mtime,0,2),count(distinct(ip)) from log where year='2021' and month='11' and day='07' group by substring(mtime,0,2) limit 10;
#
编写shell脚本将每天的小时访问量数据导出到mysql,
hive -e "create table qph as select substring(mtime,0,2),count(distinct(ip)) from log where year='2021' and month='11' and day='07' group by substring(mtime,0,2) limit 10;"

sqoop export --connect jdbc:mysql://localhost:3306/loginfo
--uername hadoop --password pwd --table daily
--fields-terminated-by '\\001' --export-dir 'user/hive/warehouse/log/qph'

hive -e "drop table qph;"
添加定时任务
crontab -e
加入以下内容
00 00 * * * /bin/sh /user/local/src/mysh/daily.sh
每天凌晨0点执行昨天的日志统计任务,储存到mysql。
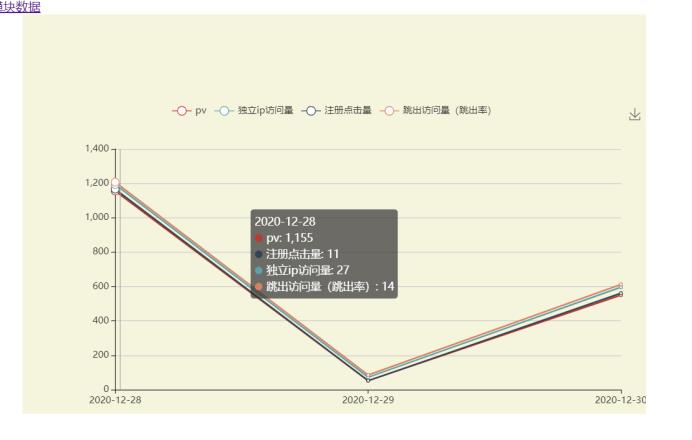
可视化数据
6.4样例
7.总结
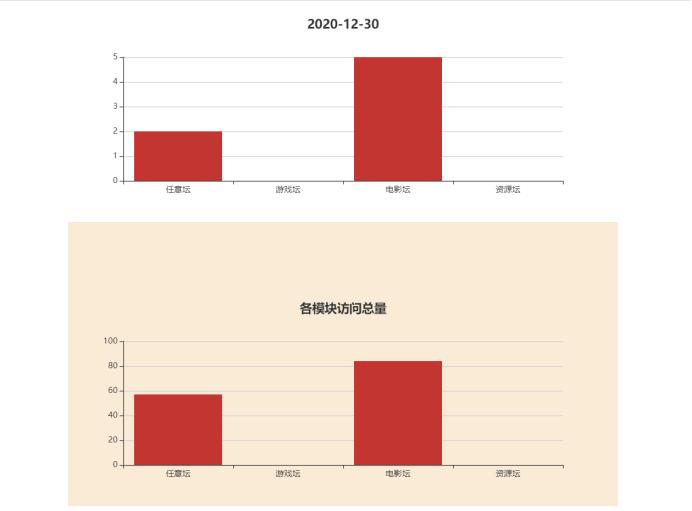
实现了分析网站访问日志,统计出关键的信息(浏览量、注册数量、独立IP访问数量、跳出率),统计各模块的访问数量,一天内每个时刻的四项指标访问量。可供网站决策者,也就是我自己,分析数据做出对热度较高的版块加关注,对热度低的板块做优化等。
缺陷与不足是,将网站和后台数据处理一并部署在一台云服务器上了,采用的单机,性能限制很大,做MapReduce清洗时服务器负载较大,特别容易挂掉。
遇到的问题与困难是,各项指标的sql和hql语句使用并不熟悉,导致导出的可使用的数据并不多。
以上是关于利用hive,怎么统计每个页面的访问时间的主要内容,如果未能解决你的问题,请参考以下文章