Linux笔记网络监控之nagios安装与配置
Posted
tags:
篇首语:本文由小常识网(cha138.com)小编为大家整理,主要介绍了Linux笔记网络监控之nagios安装与配置相关的知识,希望对你有一定的参考价值。
nagios简介
Nagios是一款开源的电脑系统和网络监视工具,能有效监控Windows、Linux和Unix的主机状态,交换机路由器等网络设置,打印机等。在系统或服务状态异常时发出邮件或短信报警第一时间通知网站运维人员,在状态恢复后发出正常的邮件或短信通知。
Nagios原名为NetSaint,由Ethan Galstad开发并维护至今。NAGIOS是一个缩写形式: "Nagios Ain‘t Gonna Insist On Sainthood" Sainthood 翻译为圣徒,而"Agios"是"saint"的希腊表示方法。Nagios被开发在Linux下使用,但在Unix下也工作得非常好。
主要功能:
1.网络服务监控(SMTP、POP3、HTTP、NNTP、ICMP、SNMP、FTP、SSH)
2.主机资源监控(CPU load、disk usage、system logs),也包括Windows主机(使用NSClient++ plugin)可以指定自己编写的Plugin通过网络收集数据来监控任何情况(温度、警告……)可以通过配置Nagios远程执行插件远程执行脚本
3.远程监控支持SSH或SSL加通道方式进行监控简单的plugin设计允许用户很容易的开发自己需要的检查服务,支持很多开发语言(shell scripts、C++、Perl、ruby、Python、php、C#等)包含很多图形化数据Plugins(Nagiosgraph、Nagiosgrapher、PNP4Nagios等)
4.可并行服务检查能够定义网络主机的层次,允许逐级检查,就是从父主机开始向下检查
当服务或主机出现问题时发出通告,可通过email, pager, sms 或任意用户自定义的plugin进行通知
5、能够自定义事件处理机制重新激活出问题的服务或主机
? 自动日志循环
? 支持冗余监控
? 包括Web界面可以查看当前网络状态,通知,问题历史,日志文件等
Nagios工作原理
Nagios的功能是监控服务和主机,但自身并没有该功能,所有的监控、检测功能都是通过插件来完成。
Nagios周期性调用插件检测服务器状态,并维持一个队列,所有插件返回状态信息都进入队列,Nagios每次从队首开始读取信息,并把状态通过web显示。
Nagios提供了许多插件,利用这些插件可以监控服务状态。安装完成后,在nagios主目录下/libexec放有nagios自带所有插件,如check_disk检查磁盘空间插件,check_load检查CPU负载等等。每一个插件可运行./check_xxx –h 查看其使用方法和功能
工作原理图如下:

Nagios安装与配置
一.nagios相关软件安装
环境准备
安装基础编译环境软件
yum install php gcc glibc glibc-common unzip gd gd-devel –y
解决perl编译问题
echo "export LC_ALL=C" >> /etc/profile
解决时间同步问题
crontab -e
/10 * /bin/sh /usr/sbin/ntpdate.sh >/dev/null 2>&1
[[email protected] nagios-plugins-2.1.2]# cat /usr/sbin/ntpdate.sh
#!/bin/bash
#date update
ntpdate s1a.time.edu.cn
1.创建nagios用户及相关的组
[[email protected] ~]#
useradd -m nagios
passwd nagios
groupadd nagcmd
usermod -a -G nagcmd nagios
usermod -a -G nagcmd apache
2.Nagios服务端安装
下载nagios服务端软件及插件
[[email protected] ~]#
wget https://assets.nagios.com/downloads/nagioscore/releases/nagios-4.2.1.tar.gz
wget https://nagios-plugins.org/download/nagios-plugins-2.1.2.tar.gz
3. 源码编译安装nagios以及相关插件
[[email protected] ~]#
tar zxf nagios-4.2.1.tar.gz
cd nagios-4.2.1
./configure --with-command-group=nagcmd
没有提示任何错误出现以下画面说明配置成功

接下来安装提示进行编译
[[email protected] ~]#
make all
编译安装并初始化配置文件
[[email protected] ~]#
make install
make install-init
make install-config
make install-webconf
make install-commandmode
安装并编译nagios插件
[[email protected] ~]#
tar -zxvf nagios-plugins-2.1.2.tar.gz
cd nagios-plugins-2.1.2
./configure --with-nagios-user=nagios --with-nagios-group=nagios
make
make install
4、配置邮件联系人信息
配置文件在目录 /usr/local/nagios/etc 下,通过这些基础配置信息可以直接启动 Nagios,现在唯一需要更改的是联系人信息,可以编辑 /usr/local/nagios/etc/objects/contacts.cfg ,将联系人邮件地址换成你自己的。
若系统中需通过安装sedmail来发送邮件
[[email protected] ~]#
yum install sendmail sendmail-cf
5.为nagios创建登录web界面的密码
[[email protected] ~]#
htpasswd -c /usr/local/nagios/etc/htpasswd.users admin
6. 编译安装nagios插件
[[email protected] ~]#
tar zxf nagios-plugins-2.1.2.tar.gz
cd nagios-plugins-2.1.2
./configure --with-nagios-user=nagios --with-nagios-group=nagios
make
make install
7. 设置nagios服务开机自启并启动ngios
设置开机自启
[[email protected] nagios]# systemctl enable nagios
[[email protected]]# chkconfig --list |grep nagios
nagios 0:off 1:off 2:on 3:on 4:on 5:on 6:off
启动nagios服务
[[email protected]]# systemctl start nagios
检查是否启动成功
[[email protected]erver nagios]# systemctl start nagios
[[email protected] nagios]# ps -ef |grep nagios
nagios 24997 1 0 17:46 ? 00:00:02 /usr/local/nagios/bin/nagios -d /usr/local/nagios/etc/nagios.cfg
nagios 25003 24997 0 17:46 ? 00:00:01 /usr/local/nagios/bin/nagios -d /usr/local/nagios/etc/nagios.cfg
nagios 25036 24997 0 17:46 ? 00:00:00 [nagios] <defunct>
nagios 25037 24997 0 17:46 ? 00:00:00 [nagios] <defunct>
nagios 25038 24997 0 17:46 ? 00:00:00 [nagios] <defunct>
nagios 25039 24997 0 17:46 ? 00:00:00 [nagios] <defunct>
nagios 25094 24997 0 17:54 ? 00:00:00 /usr/local/nagios/bin/nagios --worker /usr/local/nagios/var/rw/nagios.qh
nagios 25095 24997 0 17:54 ? 00:00:00 /usr/local/nagios/bin/nagios --worker /usr/local/nagios/var/rw/nagios.qh
nagios 25096 24997 0 17:54 ? 00:00:00 /usr/local/nagios/bin/nagios --worker /usr/local/nagios/var/rw/nagios.qh
nagios 25097 24997 0 17:54 ? 00:00:00 /usr/local/nagios/bin/nagios --worker /usr/local/nagios/var/rw/nagios.qh
root 25521 25118 0 19:21 pts/0 00:00:00 grep --color=auto nagios
存在nagios进程说明已经启动成功了
检查nagios主配置文件语法是否正确br/>[[email protected]]#
/usr/local/nagios/bin/nagios -v /usr/local/nagios/etc/nagios.cfg
我们只需关注以下两项参数即可,Total Errors 为0就说明语法正确。
Total Warnings: 0
Total Errors: 0
接下来在浏览器输入 http://服务器ip地址/nagios 登陆nagios,用户名和密码为第五步用htpasswd设置的, 出现以下画面说明您已经安装成功了

二.验证nagios服务端的监控功能,如实现监控服务器对被监控服务器磁盘负载情况的监控。
拓扑如下
环境准备
1.下载安装nrpe
[[email protected]]#
wget https://jaist.dl.sourceforge.net/project/nagios/nrpe-2.x/nrpe-2.15/nrpe-2.15.tar.gz
tar zxf nrpe-2.15.tar.gz
cd nrpe-2.15
./configure
make all
make install-plugin
make install-daemon
我在安装nrpe遇到以下错误

安装openssl-devel库即可解决
[[email protected] nrpe-2.15]# yum install openssl-devel
到此为止,nagios-server服务端的实验环境就准备好了
2.在nagios-client以同样的方式安装nigios-plugins插件和nrpe即可,详细安装步骤参考上文。
3. server-client端配置
1)加入可以监控当前client的nagios-server端的ip地址如下
allow_hosts=192.168.10.136
可用vi编辑nrpe的配置文件/usr/local/nagios/etc/nrpe.cfg修改大约在79行
我这里用sed命令修改
[[email protected] ~]# sed -i ‘s/allowed_hosts=127.0.0.1/allowed_hosts=192.168.10.136/g‘ /usr/local/nagios/etc/nrpe.cfg
检查是否修改成功

2)/usr/local/nagios/etc/nrpe.cfg文件结尾添加要监控的插件
画圈部分为默认监控的插件,如果需要监控其他内容,可添加并安装相关的插件,本实验监控的是磁盘负载check_load,已包含在默认监控的内容里面了
4) 启动nrpe
[[email protected] ~]# /usr/local/nagios/bin/nrpe -c /usr/local/nagios/etc/nrpe.cfg -d
设置开机自启
echo “/usr/local/nagios/bin/nrpe -c /usr/local/nagios/etc/nrpe.cfg –d” >> /etc/rc.local
检查服务是否启动成功
[[email protected] ~]# netstat -lnt |grep 5666
tcp 0 0 0.0.0.0:5666 0.0.0.0: LISTEN
tcp6 0 0 :::5666 ::: LISTEN
[[email protected] ~]# lsof -i :5666
COMMAND PID USER FD TYPE DEVICE SIZE/OFF NODE NAME
nrpe 46042 nagios 4u IPv4 55448 0t0 TCP :5666 (LISTEN)
nrpe 46042 nagios 5u IPv6 55449 0t0 TCP :5666 (LISTEN)
nrpe端口和进程都存在说明nrpe启动成功。
提示:重启nrpe 可以先用killall杀掉nrpe进程再启动即可
4. Nagios-server端配置。
1)创建host.cfg主机文件添加被监控的主机
这里使用lohosthost.cfg作为模板取前51行作为host.cfg的模板
[[email protected] ~]#
head -51 /usr/local/nagios/etc/objects/localhost.cfg > /usr/local/nagios/etc/objects/hosts.cfg
用vi编辑hosts.cfg改为以下内容
授权
[[email protected] ~]# chwon -R nagios.nagios /usr/local/nagios/etc/objects/hosts.cfg
2)创建services.cfg监控服务文件添加要监控的服务
[[email protected] ~]#
touch /usr/local/nagios/etc/objects/services.cfg
chwon -R nagios.nagios /usr/local/nagios/etc/objects/hosts.cfg
编辑 /usr/local/nagios/etc/objects/services.cfg文件输入如下内容
[[email protected] objects]# vi /usr/local/nagios/etc/objects/services.cfg
define service {
use generic-service ;使用templates.cfg模板的监控参数
host_name nagios-client ;被监控服务端的主机名
service_description check load
check_command check_nrpe!check_load ;要监控的服务命令
}
注意:默认使用templates.cfg模板监控的参数,若不需要,可自行定义
3)在commands.cfg 中加入check_nrp插件配置
编辑/usr/local/nagios/etc/objects/commands.cfg 在文件结尾添加以下内容
define command{
command_name check_nrpe
command_line $USER1$check_nrpe -H $HOSTADDRESS$ -c $ARG1$
}
4) 检查nagios主配置文件并重启
[[email protected] ~]# /usr/local/nagios/bin/nagios -v /usr/local/nagios/etc/nagios.cfg
Total Warnings: 0
Total Errors: 0
重启
[[email protected] ~]# /etc/init.d/nagios reload
Reloading nagios configuration (via systemctl): [ OK ]
5) 客户端测试是否有监控的主机及服务
打开浏览器出现了以下画面并没有成功监控到主机以及相关的服务
细读原来是权限出了问题,我们之前配置登录名admin没有足够的权限来访问cgi
解决方法:
把cgi.cfg的nagiosadmin全部替换成admin(我们之前设置的登录名)
[[email protected] ~]# sed -i ‘s/nagiosadmin/admin/g‘ /usr/local/nagios/etc/cgi.cfg
检查语法并重启nagios
[[email protected] ~]# /usr/local/nagios/bin/nagios -v /usr/local/nagios/etc/nagios.cfg
Total Warnings: 0
Total Errors: 0
重启
[[email protected] ~]# /etc/init.d/nagios reload
Reloading nagios configuration (via systemctl): [ OK ]
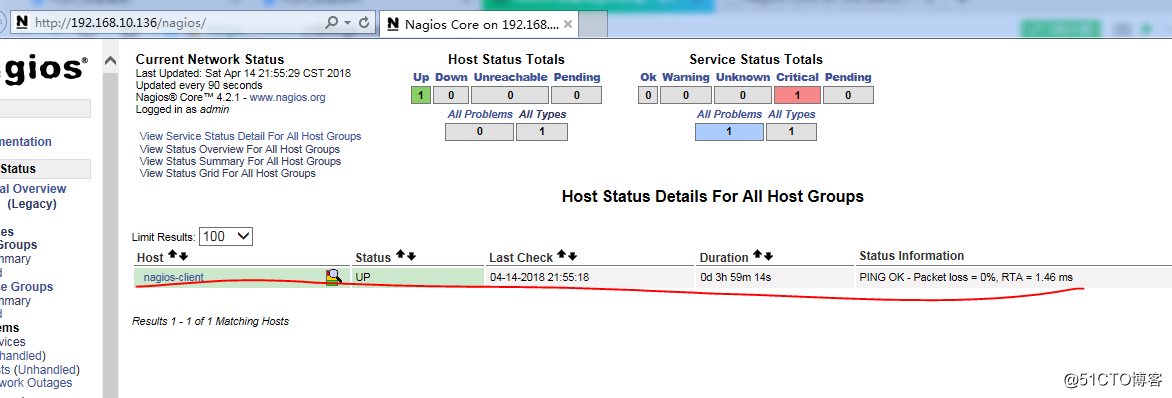
打开浏览器访问
可以看到被监控的主机的相关信息
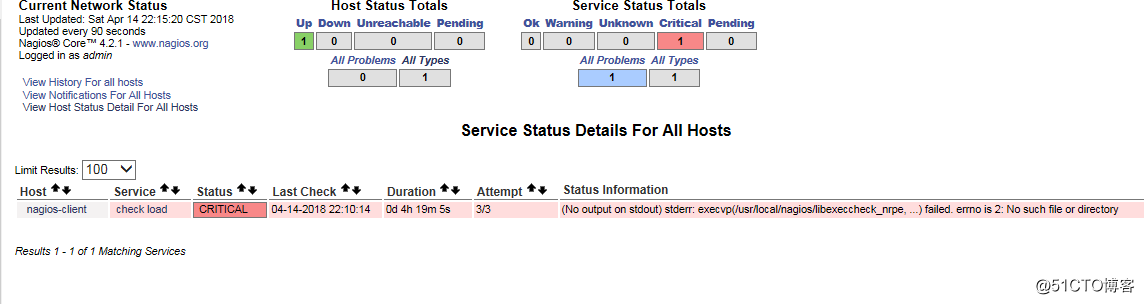
但是查看监控的服务时出现了以下异常
4.排错
1).查看nagios的错误日志
[[email protected] ~]# tail -100 /usr/local/nagios/var/nagios.log
[1523721600] LOG ROTATION: DAILY
[1523721600] LOG VERSION: 2.0
[1523721600] CURRENT HOST STATE: nagios-client;UP;HARD;1;PING OK - Packet loss = 0%, RTA = 1.16 ms
[1523721600] CURRENT SERVICE STATE: nagios-client;check load;CRITICAL;HARD;3;(Return code of 255 is out of bounds)
[1523721614] Warning: Return code of 255 for check of service ‘check load‘ on host ‘nagios-client‘ was out of bounds.
[1523721945] Caught SIGHUP, restarting...
日志大概说不能用check_load不能返回结果,看一下是不是权限问题
检查客户端nrpe配置文件是否允许服务器地址进行访问

发现是服务端的地址并没有什么问题
2).在服务用check_load脚本手动检查一下结果
[[email protected] ~]# /usr/local/nagios/libexec/check_nrpe -H 192.168.10.135 -c check_load
connect to address 192.168.10.135 port 5666: No route to host
提示没有主机的路由,查看路由表
[[email protected] ~]# route -n
Kernel IP routing table
Destination Gateway Genmask Flags Metric Ref Use Iface
0.0.0.0 192.168.10.2 0.0.0.0 UG 0 0 0 eno16777728
169.254.0.0 0.0.0.0 255.255.0.0 U 1002 0 0 eno16777728
192.168.10.0 0.0.0.0 255.255.255.0 U 0 0 0 eno16777728
这就奇怪了,明明是有默认路由的,互相ping也通
3).检查防火墙和SELinux
[[email protected] ~]# systemctl status firewall.service
Unit firewall.service could not be found.
[[email protected] ~]# systemctl status setenfore.service
Unit setenfore.service could not be found.
[[email protected] ~]# systemctl status iptables
- iptables.service - IPv4 firewall with iptables
Loaded: loaded (/usr/lib/systemd/system/iptables.service; enabled; vendor preset: disabled)
Active: active (exited) since Sun 2018-04-15 01:26:52 CST; 9s ago
Process: 75135 ExecStop=/usr/libexec/iptables/iptables.init stop (code=exited, status=0/SUCCESS)
Process: 75653 ExecStart=/usr/libexec/iptables/iptables.init start (code=exited, status=0/SUCCESS)
Main PID: 75653 (code=exited, status=0/SUCCESS)
Apr 15 01:26:52 nagios-client systemd[1]: Starting IPv4 firewall with iptables...
Apr 15 01:26:52 nagios-client iptables.init[75653]: iptables: Applying firewall rules: [ 确定 ]
Apr 15 01:26:52 nagios-client systemd[1]: Started IPv4 firewall with iptables.
最后发现是防火墙iptables没关,会不会是防火墙的问题?先把它关了试试
[[email protected] ~]# systemctl stop iptables
[[email protected] ~]# systemctl status iptables
- iptables.service - IPv4 firewall with iptables
Loaded: loaded (/usr/lib/systemd/system/iptables.service; enabled; vendor preset: disabled)
Active: inactive (dead) since Sun 2018-04-15 01:30:07 CST; 12s ago
Process: 75764 ExecStop=/usr/libexec/iptables/iptables.init stop (code=exited, status=0/SUCCESS)
Process: 75653 ExecStart=/usr/libexec/iptables/iptables.init start (code=exited, status=0/SUCCESS)
Main PID: 75653 (code=exited, status=0/SUCCESS)
Apr 15 01:26:52 nagios-client systemd[1]: Starting IPv4 firewall with iptables...
Apr 15 01:26:52 nagios-client iptables.init[75653]: iptables: Applying firewall rules: [ 确定 ]
Apr 15 01:26:52 nagios-client systemd[1]: Started IPv4 firewall with iptables.
Apr 15 01:30:06 nagios-client systemd[1]: Stopping IPv4 firewall with iptables...
Apr 15 01:30:06 nagios-client iptables.init[75764]: iptables: Setting chains to policy ACCEPT: filter [ 确定 ]
Apr 15 01:30:06 nagios-client iptables.init[75764]: iptables: Flushing firewall rules: [ 确定 ]
Apr 15 01:30:07 nagios-client iptables.init[75764]: iptables: Unloading modules: [ 确定 ]
Apr 15 01:30:07 nagios-client systemd[1]: Stopped IPv4 firewall with iptables.
4.在服务端再次用命令检测一下
[[email protected] ~]# /usr/local/nagios/libexec/check_nrpe -H 192.168.10.135 -c check_load
OK - load average: 0.97, 0.91, 0.88|load1=0.970;15.000;30.000;0; load5=0.910;10.000;25.000;0; load15=0.880;5.000;20.000;0;
可以看到结果了,果然是防火墙的问题,配置容易,排错难,遇到问题是好事,多点查阅相关的文档,多角度去考虑问题,会让你成长地更快!
我们打开浏览器再次查看,Status是OK,这恭喜你配置完成了

其实,很多其他的服务也可以通过此种方式来监控,以上我列举的只是其中一种服务而已,我就不一一举例了。
学习小提示:
学习需要总结,不然时间长了很快忘记。做笔记很重要,人脑的记忆是有限的,不可能记住全部的知识,这就需要我们用硬盘来帮我们记住具体的知识细节,我们只需记住概要即可,以后忘了再翻翻笔记,你会发现以前的知识又重新回到了脑海中。
以上是关于Linux笔记网络监控之nagios安装与配置的主要内容,如果未能解决你的问题,请参考以下文章