用python爬取全国和全球疫情数据,并进行可视化分析(过程详细代码可运行)
Posted 孙志攀
tags:
篇首语:本文由小常识网(cha138.com)小编为大家整理,主要介绍了用python爬取全国和全球疫情数据,并进行可视化分析(过程详细代码可运行)相关的知识,希望对你有一定的参考价值。
用Python爬取最新疫情数据
这次重大疫情,每时每刻数据都有可能变化,这篇博文将为大家讲解如何爬取实时疫情数据,并且分析数据,作出数据可视化的效果。
报告梗概:
对中国疫情分析
1.1 展示各省疫情具体情况(包括各省的城市)
1.2 找出国内新增疫情的城市
1.3 展示各省这次疫情感染的总人数
1.4 绘制中国疫情累计感染分布图
对中国疫情累计趋势进行分析
2.1 绘制本土累计确诊趋势图
2.2 绘制全国感染新增趋势图(最近几个月)
全球其他国家疫情分析
3.1 绘制全球各国感染总人数情况分布图
查看各国疫情发展情况
第一步:疫情数据接口获取
腾讯新闻从WHO和霍普金斯大学网站获取并整理了COVID-19的疫情跟踪数据,API接口URL为:
url1 = "https://view.inews.qq.com/g2/getOnsInfo?name=disease_h5"
url2 = "https://view.inews.qq.com/g2/getOnsInfo?name=disease_other"
url3 = "https://view.inews.qq.com/g2/getOnsInfo?name=disease_foreign"
url4 = "https://api.inews.qq.com/newsqa/v1/automation/foreign/daily/list?country=美国"
第二步:导入必要库
import numpy as np  #导入必要的库函数
import pandas as pd
import matplotlib
import matplotlib.pyplot as plt
from matplotlib.ticker import MaxNLocator
import requests
import json
from pyecharts.charts import Map, Geo
from PIL import Image
1.对中国本地的疫情进行分析
过程: 1,先从API接口得到中国本地疫情数据
2,因为提前分析过得到的json文件中’data’数据是字符串,所以把’data’转换成字典类型方便分析
url1 = "https://view.inews.qq.com/g2/getOnsInfo?name=disease_h5"
resp=requests.get(url1)
listdata=[]
listdata=resp.json()
listdata1=json.loads(listdata['data']) #把'data'转换成字典类型方便分析
#从文件中读取中国疫情的整体情况
listtime=listdata1['lastUpdateTime']
pd_china=pd.DataFrame()
pd1=pd.DataFrame(listdata1['chinaTotal'],index=['chinaTotal'], columns=['confirm', 'heal','dead','suspect','nowConfirm','nowSevere','importedCase','noInfect'])
pd_china=pd_china.append(pd1)
pd1=pd.DataFrame(listdata1['chinaAdd'],index=['chinaAdd'], columns=['confirm', 'heal','dead','suspect','nowConfirm','nowSevere','importedCase','noInfect'])
pd_china=pd_china.append(pd1)
pd_china['lastUpdateTime']=listtime
pd_china=pd_china.rename(columns="confirm": "累计确诊", "heal": "治愈","dead":"累计死亡","suspect":"疑是患者","nowConfirm":"现有患者","importedCase":"境外输入","noInfect":"无症状感染者","lastUpdateTime":"最近更新时间","nowSevere":"重症患者")
pd_china=pd_china.rename(index="chinaTotal":"中国累计","chinaAdd":"中国新增")
pd_china

1.1 对国内各省市数据进行清洗分析
areaTree=listdata1['areaTree']
china_data=areaTree[0]['children']  #获得中国各省市数据
china_data
china_list = []
for a in range(len(china_data)):
    province = china_data[a]['name']   #得到所有的省
    province_list = china_data[a]['children']   #得到每个省的城市列表
    for b in range(len(province_list)):
        city = province_list[b]['name']
        total = province_list[b]['total']
        today = province_list[b]['today']
        china_dict =               #将每个城市的信息用字典存储
        china_dict['province'] = province
        china_dict['city'] = city
        china_dict['total'] = total
        china_dict['today'] = today
        china_list.append(china_dict)
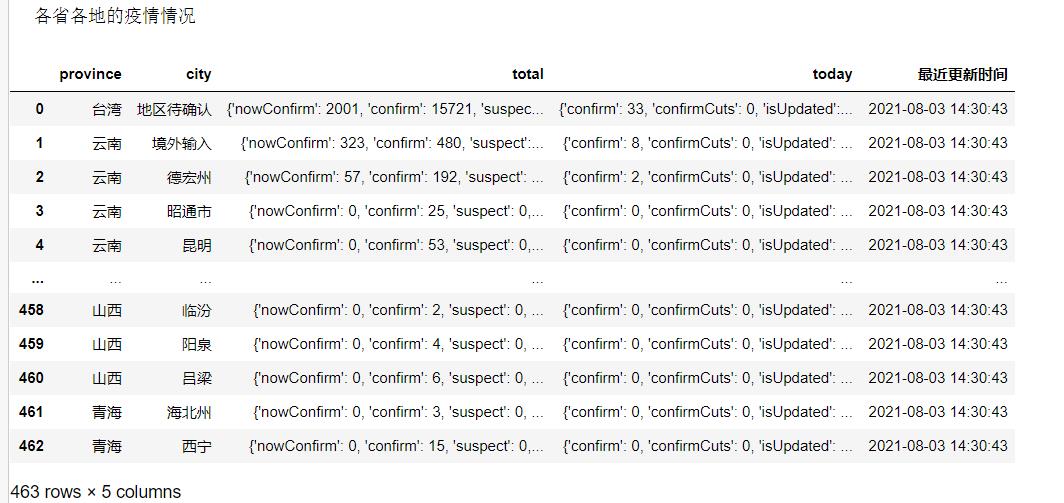
china_data = pd.DataFrame(china_list)
china_data['最近更新时间']=listtime
print('各省各地的疫情情况')
china_data

# 定义数据处理函数
def confirm(x):        # 把从上面得到的 'total'或者 'today' (均为字典类型数据) 中'confirm'对应的值输出
    confirm = eval(str(x))['confirm']
    return confirm
def suspect(x):             # 把从上面得到的 'total'或者 'today' (均为字典类型数据) 中'suspect'对应的值输出
    suspect = eval(str(x))['suspect']
    return suspect
def dead(x):              # 把从上面得到的 'total'或者 'today' (均为字典类型数据) 中'dead'对应的值输出
    dead = eval(str(x))['dead']
    return dead
def heal(x):         # 把从上面得到的 'total'或者 'today' (均为字典类型数据) 中'heal'对应的值输出
    heal =  eval(str(x))['heal']
    return heal
# 函数映射
china_data['confirm'] = china_data['total'].map(confirm)
china_data['suspect'] = china_data['total'].map(suspect)
china_data['dead'] = china_data['total'].map(dead)
china_data['heal'] = china_data['total'].map(heal)
china_data['addconfirm'] = china_data['today'].map(confirm)
china_data = china_data[["province","city","confirm","suspect","dead","heal","addconfirm"]]
china_data=china_data.rename(columns="province":"省份","city":"城市","confirm":"累计感染","suspect":"疑似","dead":"死亡","heal":"治愈","addconfirm":"新增感染")
print('各省各地的疫情具体情况')
china_data['最近更新时间']=listtime
china_data

1.2 找出国内新增疫情的城市
china_data1=china_data[china_data['新增感染']>=1]
china_data1

1.3 计算各省感染的总人数,并绘制柱状图
area_data = china_data.groupby("省份")["累计感染"].sum().reset_index()
area_data.columns = ["省份","累计感染"]
print('\\n各省份感染总人数比较\\n')
print(area_data )
matplotlib.rcParams['font.sans-serif'] = ['SimHei']  # 用黑体显示中文
# 绘图
plt.figure(figsize = (10,8),dpi=100)  #调整图像大小与像素
plt.bar(x=0,bottom=area_data['省份'],height=0.5,width=area_data['累计感染'],orientation='horizontal',label='人数',color='red',alpha=0.5 )

#在柱状图上显示具体数值, ha参数控制水平对齐方式, va控制垂直对齐方式
for x1, yy in zip(area_data['累计感染'], area_data['省份']):
  plt.text(x1+1, yy , str(x1),  va='center', fontsize=10, rotation=0)
# 设置标题
plt.title("各省感染总人数情况")
# 为两条坐标轴设置名称
plt.xlabel("感染人数")
plt.ylabel("省份")
# 显示图例
plt.legend(loc="upper right")
plt.show()
plt.close()

1.4 绘制中国疫情累计感染分布图
privince=[]
columns=[]
x=[]   # 把各省感染人数与各省对应
for i in range(len(area_data)):
    privince.append(area_data.loc[i]['省份'])
    columns.append(int(area_data.loc[i]['累计感染']))
for z in zip(list(privince), list(columns)):
    list(z)
    x.append(z)
from pyecharts.charts import Map
import pyecharts.options as opts
from pyecharts import options
from pyecharts.globals import ChartType
area_map = Map()
area_map.add("中国疫情感染人数分布图",x, "china",is_map_symbol_show=False)
area_map.set_global_opts(title_opts=opts.TitleOpts(title="中国疫情累计感染人数分布地图"),visualmap_opts=opts.VisualMapOpts(is_piecewise=True,
              pieces=[
                    "min": 1500, "label": '>10000人', "color": "#6F171F",
                    "min": 500, "max": 15000, "label": '500-1000人', "color": "#C92C34",
                    "min": 100, "max": 499, "label": '100-499人', "color": "#E35B52",
                    "min": 10, "max": 99, "label": '10-99人', "color": "#F39E86",
                    "min": 1, "max": 9, "label": '1-9人', "color": "#FDEBD0"]))
area_map.render_notebook()

2 对中国疫情累计趋势进行分析
url2 = "https://view.inews.qq.com/g2/getOnsInfo?name=disease_other"
resp=requests.get(url2)
listdata=[]
listdata=resp.json()
listdata2=json.loads(listdata['data'])
chinaDayList=listdata2['chinaDayList']  #将原数据文本中国记录的疫情数据(字典形式)装入一个数列
i=len(chinaDayList) #计算从开始统计疫情数据到今日为止的天数
china_date=pd.DataFrame()
for n in range(i):
    pd1=pd.DataFrame(data=chinaDayList[n],index=[n],columns=['confirm','dead','heal','nowConfirm','nowSevere','healRate','date'])
    china_date=china_date.append(pd1)
china_date=china_date.rename(columns="confirm":"累计确诊","dead":"累计死亡","heal":"累计治愈","nowConfirm":"现有确诊","nowSevere":"本土新增","healRate":"治愈率","date":"日期")
print('\\n全国疫情累计情况(展示最后五条)')
china_date.tail()

2.1 绘制本土累计确诊趋势图
matplotlib.rcParams['font.sans-serif'] = ['SimHei']
plt.figure(figsize=(10,4),dpi=90)    #调整大小,清晰度
plt.xticks(rotation=70)      #字体倾斜
x=np.array(china_date['日期'])
y=np.array(china_date['累计确诊'])
plt.xticks(range(0,i,4))
plt.plot(x,y)
plt.title('全国疫情累计趋势图')
plt.xlabel("日  期")
plt.ylabel("感 染 人 数")
plt.show()

2.2 绘制全国感染新增趋势图(最近几个月)
matplotlib.rcParams['font.sans-serif'] = ['SimHei']
plt.figure(figsize=(10,4),dpi=90)    #调整大小,清晰度
plt.xticks(rotation=70)      #字体倾斜
x=np.array(china_date['日期'])
y=np.array(china_date['本土新增'])
plt.xticks(range(0,i,4))
plt.plot(x,y)
plt.title('全国感染新增趋势图')
plt.xlabel("日  期")
plt.ylabel("感 染 人 数")
plt.show()

3. 全球其他国家疫情分析
url3 = "https://view.inews.qq.com/g2/getOnsInfo?name=disease_foreign"
resp=requests.get(url3)
listdata=[]
listdata=resp.json()
listdata3=json.loads(listdata['data'])
areaTree=listdata3['foreignList']  #获取各个国家总数据
country_list=pd.DataFrame()
for a in range(len(areaTree)):
    pd1=pd.DataFrame(areaTree[a],index=[a],columns=['name','continent','y','date','confirmAdd','confirm','dead','heal','nowConfirm'])
    country_list=country_list.append(pd1)
country_list=country_list.rename(columns="name":"名字","continent":"所属大洲","y":"年","date":"日期","confirmAdd":"新增","confirm":"感染","dead":"死亡","heal":"治愈","nowConfirm":"现存感染人数")
print('\\n展示前10条记录')
country_list.head(10)
3.1 绘制全球各国感染总人数情况分布图
# 创建一个空列表,用来装每个国家的相关数据
info_list = []
name2=[]
confirm2=[]
# 遍历轮询每个国家的信息
for a in range(len(areaTree)):    # 提取国家名称
    name = areaTree[a]['name']
    name2.append(name)  #  提取每个国家的确诊人数
    confirm = int(areaTree[a]["confirm"])
    confirm2.append(confirm)   #把每个国家和确诊人数放在一个元组里,然后添加到列表中
    info_tuple = (name,confirm)
    info_list.append(info_tuple)
#  将各国中文名与英文名对应
nameMap =
        'Singapore Rep.':'新加坡',
        'Dominican Rep.':'多米尼加',
        'Palestine':'巴勒斯坦',
        'Bahamas':'巴哈马',
        'Timor-Leste':'东帝汶',
        'Afghanistan':'阿富汗',
        'Guinea-Bissau':'几内亚比绍',
        "Côte d'Ivoire":'科特迪瓦',
        'Siachen Glacier':'锡亚琴冰川',
        "Br. Indian Ocean Ter.":'英属印度洋领土',
        'Angola':'安哥拉',
        'Albania':'阿尔巴尼亚',
        'United Arab Emirates':'阿联酋',以上是关于用python爬取全国和全球疫情数据,并进行可视化分析(过程详细代码可运行)的主要内容,如果未能解决你的问题,请参考以下文章