Golang | 程序性能分析工具
Posted Parker@1989
tags:
篇首语:本文由小常识网(cha138.com)小编为大家整理,主要介绍了Golang | 程序性能分析工具相关的知识,希望对你有一定的参考价值。
1. 背景
在编写完golang脚本后,发现运行没有想象中那么快,不确定是哪一步比较耗时,然后自己导入time模块,在每一个函数加上记录时间,虽然可以看到每一个函数的耗时,但是不能确定耗时原因,所以想找一个监控工具。
这里介绍两个golang程序监控利器,trace和pprof工具,这是golang自带工具,不需要另外安装。
2. trace
在代码里开启trace跟踪。
package main

import (
	"os"
	"runtime/trace"
)

func main()
	f, err := os.Create("trace.out")
	if err != nil
		panic(err)

	defer f.Close()

	err = trace.Start(f)
	if err != nil
		panic(err)

	defer trace.Stop()

  // Your program here
运行代码,然后在本地生成一个trace.out的文件。
$ go tool trace trace.out
这里会打开web浏览器,然后就可以查看了。
3. pprof
在代码里开始pprof跟踪。
import (
	"os"
	"runtime/pprof"
)

func main()
	f, err := os.Create("cpuprofile")
	if err != nil
		panic(err)

	pprof.StartCPUProfile(f)
	//pprof.WriteHeapProfile(f)   //内存分析
	defer pprof.StopCPUProfile()

	// Your program here
这里会生成一个cpuprofile文件。
$ go tool pprof cpuprofile
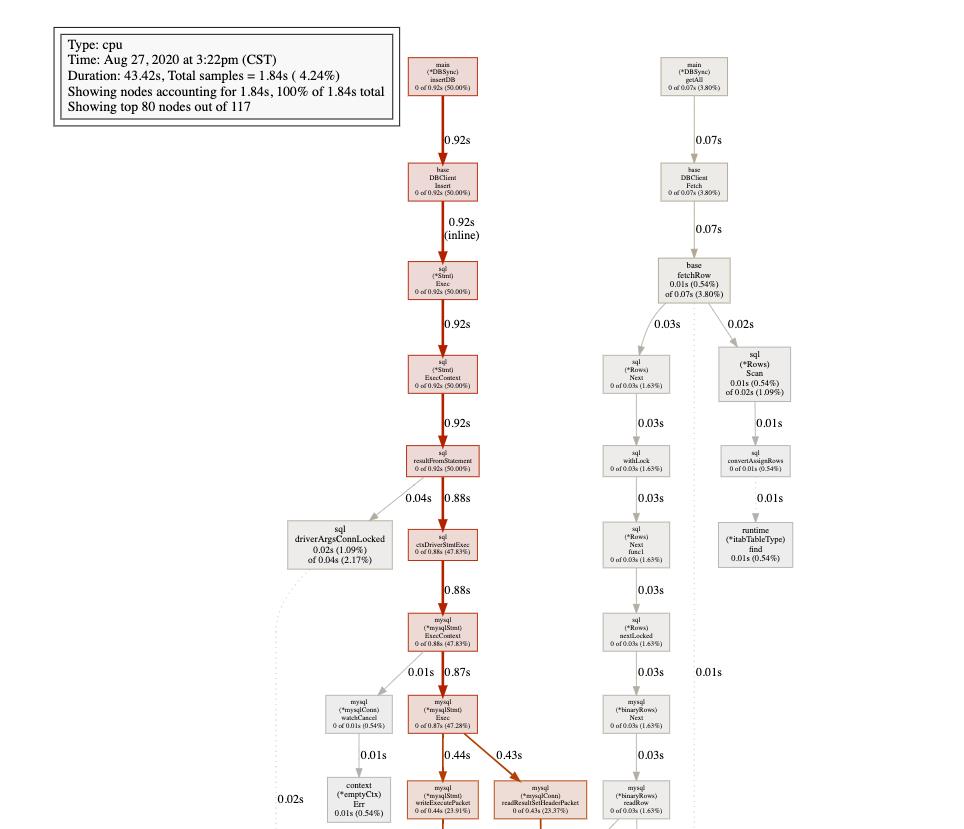
Type: cpu
Time: Aug 27, 2020 at 3:22pm (CST)
Duration: 43.42s, Total samples = 1.84s ( 4.24%)
Entering interactive mode (type "help" for commands, "o" for options)
(pprof) top5 -cum # 查看耗时前5的进程
Showing nodes accounting for 0, 0% of 1840ms total
Showing top 5 nodes out of 117
flat flat% sum% cum cum%
0 0% 0% 920ms 50.00% DBRsync/base.DBClient.Insert
0 0% 0% 920ms 50.00% database/sql.(*Stmt).Exec (inline)
0 0% 0% 920ms 50.00% database/sql.(*Stmt).ExecContext
0 0% 0% 920ms 50.00% database/sql.resultFromStatement
0 0% 0% 920ms 50.00% main.(*DBSync).insertDB
(pprof)
我们也可以执行web命令,打开web页面查看。
(pprof) web
failed to execute dot. Is Graphviz installed? Error: exec: "dot": executable file not found in $PATH
这里报错,因为没有安装Graphviz,安装一下即可。
下载地址:https://graphviz.org/download/
如果刚好你的电脑是Mac的话,就简单了,直接执行命令安装即可。
brew install Graphviz
安装完重新打开监控,输入web即可打开web页面。
以上是关于Golang | 程序性能分析工具的主要内容,如果未能解决你的问题,请参考以下文章