MATLAB 简易JK裙绘制器
Posted slandarer
tags:
篇首语:本文由小常识网(cha138.com)小编为大家整理,主要介绍了MATLAB 简易JK裙绘制器相关的知识,希望对你有一定的参考价值。
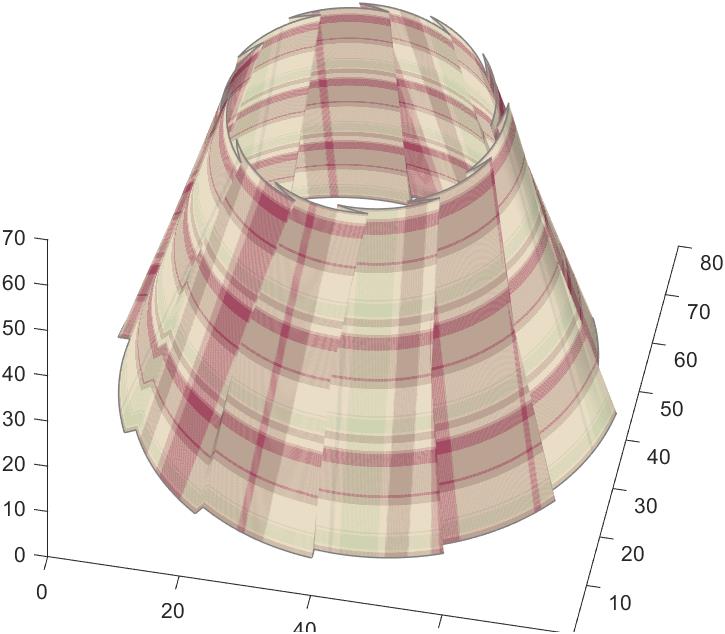
另制作了更立体版本,将其放在文章最后,效果如下:

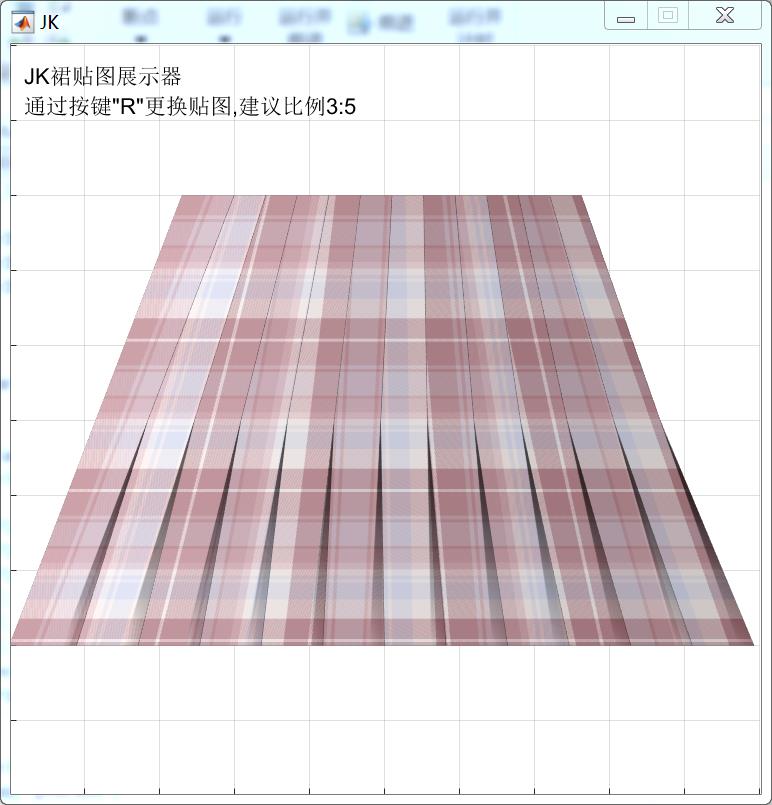
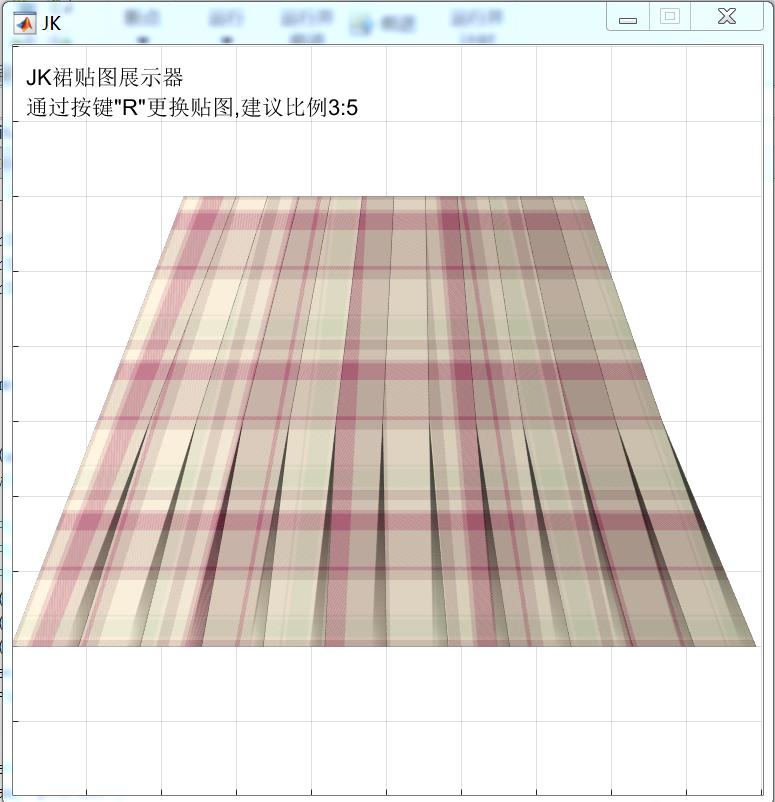
做了一个简易JK裙绘制器
使用按键R选择贴图
推荐尺寸1:1或3:5
绘制效果:


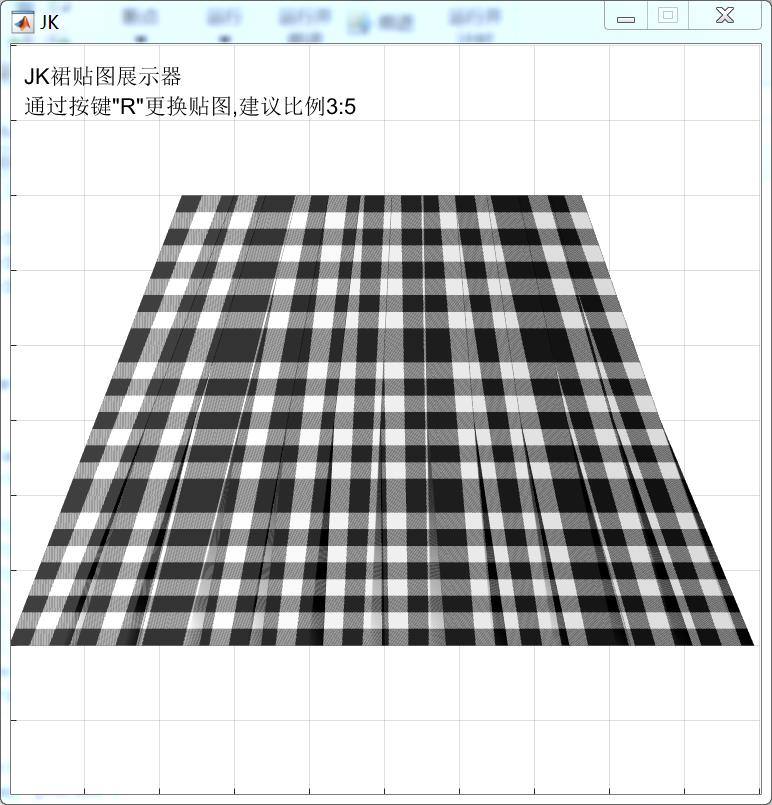
当然也可以来些恐怖的配色。。。。


完整代码:
function fillJK
fig=figure('units','pixels',...
        'position',[350 100 500 500],...
        'Numbertitle','off',...
        'name','JK',...
        'Color',[1 1 1],...
        'resize','off',...
         'menubar','none');

ax=axes('Units','pixels',...
        'parent',fig,...
        'Color',[1 1 1],...
        'Position',[0 0 500 500],...
        'XLim',[0 100],...
        'YLim',[0 100],...
        'XGrid','on','YGrid','on');
hold(ax,'on')
[Lu_X,Lu_Z]=pwLine(0:0.1:120,7,3,asin(0.1/3));
[Ld_X,Ld_Z]=pwLine(0:0.1:120,9,1,asin(0.1/1));
Lu_Y=(60+20).*ones(1,length(0:0.1:120));
Ld_Y=20.*ones(1,length(0:0.1:120));

Lu_X=Lu_X+(max(Ld_X)-max(Lu_X))/2;
%plot3(Lu_X,Lu_Y,Lu_Z)
%plot3(Ld_X,Ld_Y,Ld_Z)

Xset=inter3D(Lu_X',Ld_X',length(Lu_X));
Yset=inter3D(Lu_Y',Ld_Y',length(Lu_Y));
Zset=inter3D(Lu_Z',Ld_Z',length(Lu_Z));

Pic=[];
try
    Pic=imread('示例.png');
catch
end
h=surface(ax,Xset,Yset,Zset,'FaceColor','texturemap','EdgeColor','texturemap');
if isempty(Pic)
else
    PicR=Pic(:,:,1);PicR=PicR';
    PicG=Pic(:,:,2);PicG=PicG';
    PicB=Pic(:,:,3);PicB=PicB';
    tpPic(:,:,1)=PicR;
    tpPic(:,:,2)=PicG;
    tpPic(:,:,3)=PicB;
    w=fspecial('gaussian',[3 3],3);
    flPic=imfilter(tpPic,w);
    set(h,'CData',flPic,'FaceColor','texturemap','EdgeColor','texturemap')
end
lightangle(ax,-10,61)
lighting(ax,'gouraud')
shading(ax,'flat')
text(2,96,'JK裙贴图展示器','FontSize',11)
text(2,92,'通过按键"R"更换贴图,建议比例3:5','FontSize',11)

set(gcf, 'KeyPressFcn', @key)
function key(~,event)
    if event.Key=='r'
        try
        [filename, pathname] = uigetfile('*.jpg;*.tif;*.png;*.gif','All Image Files';...
            '*.*','All Files' );
        Pic=[];
        Pic=imread([ pathname,filename]);
        PicR=Pic(:,:,1);PicR=PicR';
        PicG=Pic(:,:,2);PicG=PicG';
        PicB=Pic(:,:,3);PicB=PicB';
        if size(Pic,1)==size(Pic,2)
            PicR=repmat(PicR,[5,3]);
            PicG=repmat(PicG,[5,3]);
            PicB=repmat(PicB,[5,3]);
        end
        tpPic(:,:,1)=PicR;
        tpPic(:,:,2)=PicG;
        tpPic(:,:,3)=PicB;
        w=fspecial('gaussian',[3 3],3);
        flPic=imfilter(tpPic,w);
        set(h,'CData',flPic)
        catch
        end
    end
end


    function Pset=inter3D(P1,P2,N)
        coeMat=linspace(0,1,N);
        Pset=P1+(P2-P1)*coeMat;
    end

    function [newX,newY]=pwLine(X,p1L,p2L,theta)
        newX=X(1);
        newY=0;
        for i=2:length(X)
            dX=X(i)-X(i-1);
            if mod(X(i),p1L+p2L)<=p1L
                newX=[newX,newX(end)+dX];
                newY=[newY,newY(end)-0];
            else
                newX=[newX,newX(end)-dX*cos(theta)];
                newY=[newY,newY(end)-dX*sin(theta)];
            end
        end
    end


end
贴图的绘制当然要参考前面写的那篇,格柄生成器的文章啦:
MATLAB 简易格柄生成器
更立体版本代码:
function fillJK2
fig=figure('units','pixels',...
        'position',[350 100 500 500],...
        'Numbertitle','off',...
        'name','JK',...
        'Color',[1 1 1],...
        'resize','off');%,...
%         'menubar','none');

ax=axes('Units','pixels',...
        'DataAspectRatioMode','manual',...
        'parent',fig,...
        'Color',[1 1 1],...
        'Position',[0 0 500 500],...
        'XLim',[0 80],...
        'YLim',[0 80],...
        'ZLim',[0 70]);
hold(ax,'on')
L11=15;L12=5;h1=1.5;
L21=18;L22=2;h2=2;
[Lu_t,Lu_r]=pwLine(0:0.2:240,L11,L12,h1);
[Ld_t,Ld_r]=pwLine(0:0.2:240,L21,L22,h2);
totalL_u=240/20*(sqrt(L11^2-h1^2)-sqrt(L12^2-h1^2));
totalL_d=240/20*(sqrt(L21^2-h2^2)-sqrt(L22^2-h2^2));
rMid_u=totalL_u/2/pi;
rMid_d=totalL_d/2/pi;

Lu_t=Lu_t./(max(Lu_t)-sqrt(L12^2-h1^2)).*2.*pi;
Lu_r=Lu_r+rMid_u;
Ld_t=Ld_t./(max(Ld_t)-sqrt(L22^2-h2^2)).*2.*pi;
Ld_r=Ld_r+rMid_d;

Lu_X=cos(Lu_t).*Lu_r+40;
Lu_Y=sin(Lu_t).*Lu_r+40;
Lu_Z=ones(size(Lu_Y)).*65;
Ld_X=cos(Ld_t).*Ld_r+40;
Ld_Y=sin(Ld_t).*Ld_r+40;
Ld_Z=ones(size(Ld_Y)).*6;

plot3(Lu_X,Lu_Y,Lu_Z,'color',[0.5 0.5 0.5],'LineWidth',0.7)
plot3(Ld_X,Ld_Y,Ld_Z,'color',[0.5 0.5 0.5],'LineWidth',0.7)


Xset=inter3D(Lu_X',Ld_X',length(Lu_X));
Yset=inter3D(Lu_Y',Ld_Y',length(Lu_Y));
Zset=inter3D(Lu_Z',Ld_Z',length(Lu_Z));
%Xset=Xset+rand(size(Xset))./50;
%Yset=Yset+rand(size(Yset))./50;
h=surface(ax,Xset,Yset,Zset,'FaceColor','texturemap','EdgeColor','texturemap');
Pic=[];
try
    Pic=imread('示例.png');
catch
end
if isempty(Pic)
else
    PicR=Pic(:,:,1);PicR=PicR';
    PicG=Pic(:,:,2);PicG=PicG';
    PicB=Pic(:,:,3);PicB=PicB';
    if size(Pic,1)==size(Pic,2)
        PicR=repmat(PicR,[4,1]);
        PicG=repmat(PicG,[4,1]);
        PicB=repmat(PicB,[4,1]);
    end
    tpPic(:,:,1)=PicR;
    tpPic(:,:,2)=PicG;
    tpPic(:,:,3)=PicB;
    w=fspecial('gaussian',[3 3],3);
    flPic=imfilter(tpPic,w);
    set(h,'CData',flPic)
end
lightangle(ax,-10,30)
material([0.8 1 0.05])
lighting(ax,'gouraud')
shading(ax,'flat')
    function Pset=inter3D(P1,P2,N)
        coeMat=linspace(0,1,N);
        Pset=P1+(P2-P1)*coeMat;
    end

    function [newX,newY]=pwLine(X,p1L,p2L,h)
        newX=X(1);
        newY=0;
        theta1=asin(h/p1L);
        theta2=asin(h/p2L);
        for i=2:length(X)
            dX=X(i)-X(i-1);
            if mod(X(i),p1L+p2L)<=p1L
                newX=[newX,newX(end)+dX*cos(theta1)];
                newY=[newY,newY(end)+dX*sin(theta1)];
            else
                newX=[newX,newX(end)-dX*cos(theta2)];
                newY=[newY,newY(end)-dX*sin(theta2)];
            以上是关于MATLAB 简易JK裙绘制器的主要内容,如果未能解决你的问题,请参考以下文章