使用树状图可视化聚类
Posted deephub
tags:
篇首语:本文由小常识网(cha138.com)小编为大家整理,主要介绍了使用树状图可视化聚类相关的知识,希望对你有一定的参考价值。
一般情况下,我们都是使用散点图进行聚类可视化,但是某些的聚类算法可视化时散点图并不理想,所以在这篇文章中,我们介绍如何使用树状图(Dendrograms)对我们的聚类结果进行可视化。
树状图
树状图是显示对象、组或变量之间的层次关系的图表。树状图由在节点或簇处连接的分支组成,它们代表具有相似特征的观察组。分支的高度或节点之间的距离表示组之间的不同或相似程度。也就是说分支越长或节点之间的距离越大,组就越不相似。分支越短或节点之间的距离越小,组越相似。
树状图对于可视化复杂的数据结构和识别具有相似特征的数据子组或簇很有用。它们通常用于生物学、遗传学、生态学、社会科学和其他可以根据相似性或相关性对数据进行分组的领域。
背景知识:
“树状图”一词来自希腊语“dendron”(树)和“gramma”(绘图)。1901年,英国数学家和统计学家卡尔皮尔逊用树状图来显示不同植物种类之间的关系[1]。他称这个图为“聚类图”。这可以被认为是树状图的首次使用。
数据准备
我们将使用几家公司的真实股价来进行聚类。为了方便获取,所以使用 Alpha Vantage 提供的免费 API 来收集数据。Alpha Vantage同时提供免费 API 和高级 API,通过API访问需要密钥,请参考他的网站。
 importpandasaspd
 importrequests

 companies='Apple':'AAPL','Amazon':'AMZN','Facebook':'META','Tesla':'TSLA','Alphabet (Google)':'GOOGL','Shell':'SHEL','Suncor Energy':'SU',
            'Exxon Mobil Corp':'XOM','Lululemon':'LULU','Walmart':'WMT','Carters':'CRI','Childrens Place':'PLCE','TJX Companies':'TJX',
            'Victorias Secret':'VSCO','MACYs':'M','Wayfair':'W','Dollar Tree':'DLTR','CVS Caremark':'CVS','Walgreen':'WBA','Curaleaf':'CURLF'
科技、零售、石油和天然气以及其他行业中挑选了 20 家公司。
 importtime

 all_data=
 forkey,valueincompanies.items():
 # Replace YOUR_API_KEY with your Alpha Vantage API key
   url=f'https://www.alphavantage.co/query?function=TIME_SERIES_DAILY_ADJUSTED&symbol=value&apikey=<YOUR_API_KEY>&outputsize=full'
   response=requests.get(url)
   data=response.json()
   time.sleep(15)
   if'Time Series (Daily)'indataanddata['Time Series (Daily)']:
     df=pd.DataFrame.from_dict(data['Time Series (Daily)'], orient='index')
     print(f'Received data for key')
   else:
     print("Time series data is empty or not available.")
   df.rename(columns= '1. open':key, inplace=True)
   all_data[key]=df[key]
在上面的代码在 API 调用之间设置了 15 秒的暂停,这样可以保证不会因为太频繁被封掉。
 # find common dates among all data frames
 common_dates=None
 fordf_key, dfinall_data.items():
     ifcommon_datesisNone:
         common_dates=set(df.index)
     else:
         common_dates=common_dates.intersection(df.index)

 common_dates=sorted(list(common_dates))

 # create new data frame with common dates as index
 df_combined=pd.DataFrame(index=common_dates)

 # reindex each data frame with common dates and concatenate horizontally
 fordf_key, dfinall_data.items():
     df_combined=pd.concat([df_combined, df.reindex(common_dates)], axis=1)
将上面的数据整合成我们需要的DF,下面就可以直接使用了
层次聚类
层次聚类(Hierarchical clustering)是一种用于机器学习和数据分析的聚类算法。它使用嵌套簇的层次结构,根据相似性将相似对象分组到簇中。该算法可以是聚集性的可以从单个对象开始并将它们合并成簇,也可以是分裂的,从一个大簇开始并递归地将其分成较小的簇。
需要注意的是并非所有聚类方法都是层次聚类方法,只能在少数聚类算法上使用树状图。
聚类算法我们将使用 scipy 模块中提供的层次聚类。
1、自上而下聚类
 importnumpyasnp
 importscipy.cluster.hierarchyassch
 importmatplotlib.pyplotasplt

 # Convert correlation matrix to distance matrix
 dist_mat=1-df_combined.corr()

 # Perform top-down clustering
 clustering=sch.linkage(dist_mat, method='complete')
 cuts=sch.cut_tree(clustering, n_clusters=[3, 4])

 # Plot dendrogram
 plt.figure(figsize=(10, 5))
 sch.dendrogram(clustering, labels=list(df_combined.columns), leaf_rotation=90)
 plt.title('Dendrogram of Company Correlations (Top-Down Clustering)')
 plt.xlabel('Companies')
 plt.ylabel('Distance')
 plt.show()

如何根据树状图确定最佳簇数
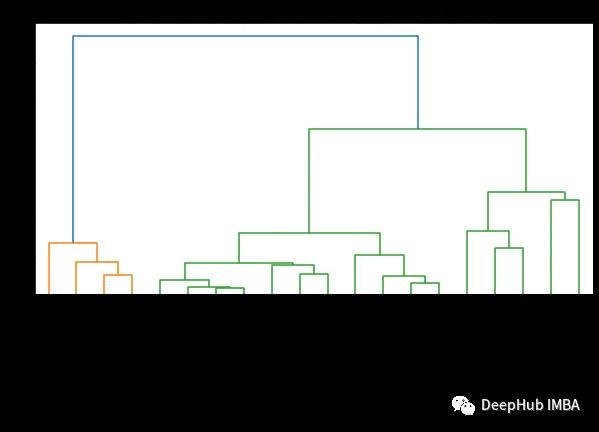
找到最佳簇数的最简单方法是查看生成的树状图中使用的颜色数。最佳簇的数量比颜色的数量少一个就可以了。所以根据上面这个树状图,最佳聚类的数量是两个。
另一种找到最佳簇数的方法是识别簇间距离突然变化的点。这称为“拐点”或“肘点”,可用于确定最能捕捉数据变化的聚类数量。上面图中我们可以看到,不同数量的簇之间的最大距离变化发生在 1 和 2 个簇之间。因此,再一次说明最佳簇数是两个。
从树状图中获取任意数量的簇
使用树状图的一个优点是可以通过查看树状图将对象聚类到任意数量的簇中。例如,需要找到两个聚类,可以查看树状图上最顶部的垂直线并决定聚类。比如在这个例子中,如果需要两个簇,那么第一个簇中有四家公司,第二个集群中有 16 个公司。如果我们需要三个簇就可以将第二个簇进一步拆分为 11 个和 5 个公司。如果需要的更多可以依次类推。
2、自下而上聚类
 importnumpyasnp
 importscipy.cluster.hierarchyassch
 importmatplotlib.pyplotasplt

 # Convert correlation matrix to distance matrix
 dist_mat=1-df_combined.corr()

 # Perform bottom-up clustering
 clustering=sch.linkage(dist_mat, method='ward')

 # Plot dendrogram
 plt.figure(figsize=(10, 5))
 sch.dendrogram(clustering, labels=list(df_combined.columns), leaf_rotation=90)
 plt.title('Dendrogram of Company Correlations (Bottom-Up Clustering)')
 plt.xlabel('Companies')
 plt.ylabel('Distance')
 plt.show()

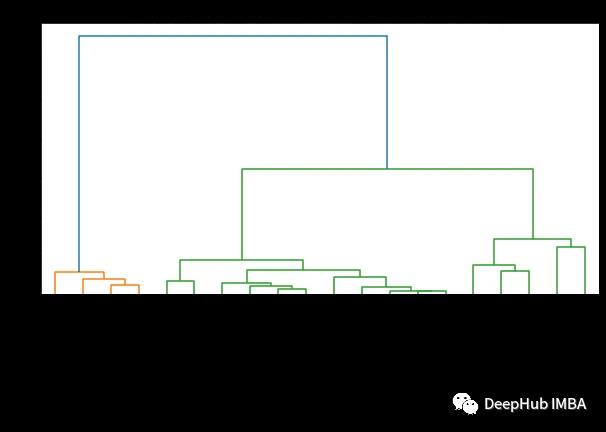
我们为自下而上的聚类获得的树状图类似于自上而下的聚类。最佳簇数仍然是两个(基于颜色数和“拐点”方法)。但是如果我们需要更多的集群,就会观察到一些细微的差异。这也很正常,因为使用的方法不一样,导致结果会有一些细微的差异。
总结
树状图是可视化复杂数据结构和识别具有相似特征的数据子组或簇的有用工具。在本文中,我们使用层次聚类方法来演示如何创建树状图以及如何确定最佳聚类数。对于我们的数据树状图有助于理解不同公司之间的关系,但它们也可以用于其他各种领域,以理解数据的层次结构。
https://avoid.overfit.cn/post/1271784ad1ea4ff28eea9ef3c9f6f498
作者:Shashindra Silva
在距离高度从 SciPy 切割树状图/聚类树
【中文标题】在距离高度从 SciPy 切割树状图/聚类树【英文标题】:Cutting Dendrogram/Clustering Tree from SciPy at distance height 【发布时间】:2016-07-31 03:28:52 【问题描述】:我正在尝试学习如何在 Python 中使用 dendrograms 使用 SciPy 。我想获得集群并能够可视化它们;我听说hierarchical clustering 和dendrograms 是最好的方法。
如何在特定距离“砍”树?
在这个例子中,我只想在距离1.6 处切割它
我在https://joernhees.de/blog/2015/08/26/scipy-hierarchical-clustering-and-dendrogram-tutorial/#Inconsistency-Method 上查找了一个教程,但是这家伙使用**kwargs 做了一些非常令人困惑的包装函数(他称他的阈值max_d)
这是我的代码和下面的情节;为了重现性,我尝试尽可能地对其进行注释:
from __future__ import print_function
import matplotlib.pyplot as plt
import numpy as np
import pandas as pd
from scipy.cluster.hierarchy import dendrogram,linkage,fcluster
from scipy.spatial import distance
np.random.seed(424173239) #43984

#Dims
n,m = 20,7

#DataFrame: rows = Samples, cols = Attributes
attributes = ["a" + str(j) for j in range(m)]
DF_data = pd.DataFrame(np.random.random((n, m)), columns = attributes)

A_dist = distance.cdist(DF_data.as_matrix().T, DF_data.as_matrix().T)

#(i) . Do the labels stay in place from DF_data for me to do this?
DF_dist = pd.DataFrame(A_dist, index = attributes, columns = attributes)

#Create dendrogram
fig, ax = plt.subplots()
Z = linkage(distance.squareform(DF_dist.as_matrix()), method="average")
D_dendro = dendrogram(Z, labels = attributes, ax=ax) #create dendrogram dictionary
threshold = 1.6 #for hline
ax.axhline(y=threshold, c='k')
plt.show()

#(ii) How can I "cut" the tree by giving it a distance threshold?
#i.e. If I cut at 1.6 it would make (a5 : cluster_1 or not in a cluster), (a2,a3 : cluster_2), (a0,a1 : cluster_3), and (a4,a6 : cluster_4)

#link_1 says use fcluster
#This -> fcluster(Z, t=1.5, criterion='inconsistent', depth=2, R=None, monocrit=None)
#gives me -> array([1, 1, 1, 1, 1, 1, 1], dtype=int32)

print(
     len(set(D_dendro["color_list"])), "^ # of colors from dendrogram",
     len(D_dendro["ivl"]), "^ # of labels",sep="\n")
#3
#^ # of colors from dendrogram it should be 4 since clearly (a6, a4) and a5 are in different clusers
#7
#^ # of labels
link_1:How to compute cluster assignments from linkage/distance matrices in scipy in Python?
【问题讨论】:
Related question... @SaulloCastro 对此表示感谢。是的,肯定有关系。一种有趣的方式,只通过水平移动树木。看看实际的图表是如何绘制的也很酷。 【参考方案1】:color_threshold 是我正在寻找的方法。当color_palette 对于生成的集群数量来说太小时,它并没有真正的帮助。如果有人可以提供帮助,请将下一步迁移到 Bigger color-palette in matplotlib for SciPy's dendrogram (Python)。
【讨论】:
【参考方案2】:对于更大的调色板,这应该可以:
from scipy.cluster import hierarchy as hc
import matplotlib.cm as cm
import matplotlib.colors as col

#get a color spectrum "gist_ncar" from matplotlib cm.
#When you have a spectrum it begins with 0 and ends with 1.
#make tinier steps if you need more than 10 colors

colors = cm.gist_ncar(np.arange(0, 1, 0.1))

colorlst=[]# empty list where you will put your colors
for i in range(len(colors)): #get for your color hex instead of rgb
    colorlst.append(col.to_hex(colors[i]))

hc.set_link_color_palette(colorlst) #sets the color to use.
把所有这些放在你的代码前面,它应该可以工作
【讨论】:
以上是关于使用树状图可视化聚类的主要内容,如果未能解决你的问题,请参考以下文章