[Enthought Traning] Scientific Computing in Python
Posted ZJun310
tags:
篇首语:本文由小常识网(cha138.com)小编为大家整理,主要介绍了[Enthought Traning] Scientific Computing in Python相关的知识,希望对你有一定的参考价值。
[建议打开目录查看]
Enthought Traning
Scientific Computing

Data Interpolation
Normal Interpolation
# Data: x y
from scipy.interpolate import interp1d
# Basic
Interpolation = interp1d(x,y)
# With option bounds_error=False, interp1d won't raise an exception on extrapolation
Interpolation = interp1d(x,y,bounds_error = False)
# Fill nan with num when interpolate on extra Interval
Interpolation = interp1d(x,y,bounds_error = False,fill_value=-100)
# Kinds of Interpolation
Interpolation = interp1d(x,y,kind="linear")
# More Opitions : 'nearest','zero','quadratic','cubic',...
#Other Interpolation
from scipy.interpolate import interp2d, interpnd
Radial basis function
Radial basis functions are typically used to build up function approximations of the form
Approximation schemes of this kind have been particularly used in time series prediction and control of nonlinear systems exhibiting sufficiently simple chaotic behaviour, 3D reconstruction in computer graphics
Types
- Gaussian
ϕ(r)=e−(εr)2
- Multiquadric:
ϕ(r)=1+(εr)2‾‾‾‾‾‾‾‾‾√
- Inverse quadratic
ϕ(r)=11+(εr)2
- Inverse multiquadric:
ϕ(r)=11+(εr)2‾‾‾‾‾‾‾‾‾√
from scipy.interpolate.rbf import Rbf
Interpolation = Rbf(x, y, function = "multiquadric")
from numpy import (linspace, exp, sqrt, mgrid, pi, cos)
from mpl_toolkits.mplot3d import Axes3D
#3D data
x, y = mgrid[-pi/2:pi/2:5j, -pi/2:pi/2:5j]
z = cos(sqrt(x**2 + y**2))

#plot 3D scatter
fig = figure(figsize=(12,6))
ax = fig.gca(projection="3d")
ax.scatter(x,y,z)

#interpolate
zz = Rbf(x, y, z)

#plot 3D surface
xx, yy = mgrid[-pi/2:pi/2:50j, -pi/2:pi/2:50j]
fig = figure(figsize=(12,6))
ax = fig.gca(projection="3d")
ax.plot_surface(xx,yy,zz(xx,yy),rstride=1, cstride=1, cmap=cm.jet)
Statistics in Python
spicy.stats.stats
import scipy.stats.stats as stProbability Distribution
Continuous Distribution Methods
pdf/cdf/rvs/ppf/stats/fit/sf/isf/entropy/…
Distrete Distribution Methods
pmf/cdf/rvs/ppf/stats/sf/isf/…
Continuous Distribution
from scipy.stats import norm
from scipy stats import t # t distribution
# generate random variables
x_norm = norm.rvs(size=500)
# fit a specific distribution
x_mean.x_std = norm.fit(x_norm)
# Draw distribution
x=linspace(-3,3,50)
h = plt.hist(x_norm,normed = Ture ,bins =20)
p = plt.plot(x,norm.pdf(x),'r-')
#calculate probability based on pdf in certain range and then draw the picture
from scipy.stats import norm
from scipy.integrate import trapz
import numpy as np
import matplotlib.pyplot as plt
x1 = np.linspace(-2,2,100)
p = trapz(norm.pdf(x1),x1)
print ':.2%'.format(p)
fb = plt.fill_between(x1,norm.pdf(x1),color = 'gray')
x=np.linspace(-3,3,50)
p = plt.plot(x,norm.pdf(x),'k-')
More about distribution
loc , scale
P = plt.plot(x,norm.pdf(x,loc = 0.5,scale = 2),label = 's=2')
legend()
Discrete Distribution
# Binom / Poisson / uniform distribution
from scipy.stats import binom,poisson,randint
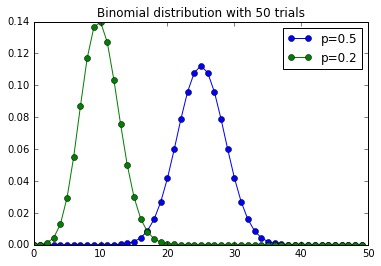
# Binomial Distribution
num_trials = 50
x = arange(num_trials)
p = plot(x, binom(num_trials, 0.5).pmf(x), "o-", label="p=0.5")
p = plot(x, binom(num_trials, 0.2).pmf(x), "o-", label="p=0.2")
l = legend(loc="upper right")
t = title("Binomial distribution with 50 trials")
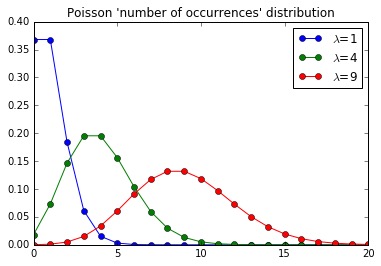
x = arange(0,21)
p = plot(x, poisson(1).pmf(x), 'o-', label=r"$\\lambda$=1")
p = plot(x, poisson(4).pmf(x), 'o-', label=r"$\\lambda$=4")
p = plot(x, poisson(9).pmf(x), 'o-', label=r"$\\lambda$=9")
l = legend()
t = title("Poisson 'number of occurrences' distribution")
Our Own Discrete Distribution
Can be used in sampling
from scipy.stats import rv_discrete
# Dice Example
xk = [1, 2, 3, 4, 5, 6]
pk = [0.3, 0.35, 0.25, 0.05, 0.025, 0.025]
loaded = rv_discrete(values=(xk, pk))
samples = loaded.rvs(size=100)
Hypothesis Testing
from scipy.stats import norm
from scipy.stats import ttest_ind, ttest_rel, ttest_1samp
#[ttest_ind]Calculates the T-test for the means of TWO INDEPENDENT samples of scores
#[ttest_rel]Calculates the T-test on TWO RELATED samples of scores, before and after
#[ttest_1samp]Calculates the T-test for the mean of ONE group of scores
from scipy.stats import t
n1 = norm(loc=0.5, scale=1.0)
n2 = norm(loc=0, scale=1.0)
n1_samples = n1.rvs(size=100)
n2_samples = n2.rvs(size=100)
# T test
t_val, p_val = ttest_ind(n1_samples, n2_samples)
#t_val = 1.05831471112
#p_val = 0.291201401071
Curve Fitting
Random Generate
np.random.__
Linear polynomial fitting
from numpy import polyfit, poly1d
x = np.linspace(-5, 5, 100)
y = 4 * x + 1.5
noisy_y = y + np.random.randn(y.shape[-1]) * 2.5
coefficients = polyfit(x, noisy_y, 1)
f = poly1d(coefficients) # Generate The Polynomial Function
#y = poly1d([1,2,3])
#print y
#x^2+2x+3
Least-Squares Fitting
from scipy.linalg import lstsq
from scipy.stats import linregress
from scipy.optimize import leastsq
Transform x
X = np.hstack((x[:,newaxis], np.ones((x.shape[-1],1))))
x = np.linspace(0, 5, 100)
y = 0.5 * x + np.random.randn(x.shape[-1]) * 0.35
X = np.hstack((x[:,newaxis], np.ones((x.shape[-1],1))))
C, resid, rank, s = linalg.lstsq(X, y)
print 'coefficients = '.format(C)
print "sum squared residual = :.3f".format(resid[0])
print "rank of the X matrix = ".format(rank)
print "singular values of X = ".format(s)
slope, intercept, r_value, p_value, stderr = linregress(x, y)Curve fitting with callables
def fun(x,a,b,c):
    return a*x*x+b*x+c
y= fun(10,*[2,3,4])
General Way For Curve Fitting
from scipy.optimize import curve_fit
def function(x,a,b,c):
    return a*x*x+b*x+c
p_est, err_est = curve_fit(function, x, y)
Minimization
In general, the optimization problems are of the form:

    minimize f(x) subject to
        g_i(x) >= 0,  i = 1,...,m
        h_j(x)  = 0,  j = 1,...,p

    where x is a vector of one or more variables.
    ``g_i(x)`` are the inequality constraints.
    ``h_j(x)`` are the equality constrains.
minimize(fun, x0, args=(), method=None, jac=None, hess=None, hessp=None, bounds=None, constraints=(), tol=None, callback=None, options=None)
from scipy.optimize import minimize
def rosenbrock(x,y):
    return (1-x)*(1-x)+100*(y-x*x)*(y-x*x)
x = [3,2]
xi=[x0]
result = minimize(rosen, x0, callback=xi.append)
X_min = result.x
result.fun
#or use
Fun_minimize = rosenbrock(*result.x)
Symbolic Integration
from sympy import symbols, integrate
import sympy
x, y = symbols('x y')
z = sympy.sqrt(x ** 2 + y **2)
z.subs(x, 3)
z.subs(x, 3).subs(y, 4)
from sympy.abc import theta
y = sympy.sin(theta) ** 2
Y = integrate(y)
#theta/2 - sin(theta)*cos(theta)/2
integrate(y, (theta, 0, sympy.pi))
integrate(y, (theta, 0, sympy.pi)).evalf()Learn More
import sympy
x ,z= symbols('x z')
y = x*x + sin(x) +3*z
print sympy.diff(y,x)
print sympy.diff(y,z)
m = sympy.diff(y,x)
m.subs(x,2).evalf()
Numerical Integration
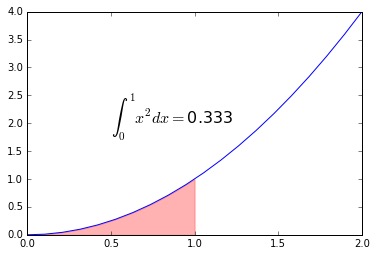
Normal integration
from matplotlib.pyplot import plot, annotate, fill_between, figure
import numpy as np
def f(x):
    return x*x
from scipy.integrate import quad
interval = [0, 1]
value, max_err = quad(f, *interval)
x=np.linspace(0,2,20)
plot(x,f(x),'-')
x_interval = np.linspace(0,1,10)
fill_between(x_interval,f(x_interval),color='r',alpha=0.3)
annotate(r"$\\int_0^1x^2dx = $" + ":.3".format(value), (0.5, 2),
         fontsize=16)
Double integration
Example:
from scipy.integrate import dblquad
@vectorize
def I(n):
    x_lower = 0
    x_upper = inf
    return dblquad(h, x_lower, x_upper,lambda t_lower: 1, lambda t_upper: inf, args=(n,))
I([0.5, 1.0, 2.0, 5])
Integration of sampled data
from scipy.integrate import trapz, simpsTrapezoidal Integration
x = linspace(0, pi, 100)
y = sin(x)
result = simps(y, x)
Trapezoidal Integration
x = linspace(0, pi, 100)
y = sin(x)
result = trapz(y, x)
以上是关于[Enthought Traning] Scientific Computing in Python的主要内容,如果未能解决你的问题,请参考以下文章