mapboxGL中多图标加载的实现
Posted 牛老师讲GIS
tags:
篇首语:本文由小常识网(cha138.com)小编为大家整理,主要介绍了mapboxGL中多图标加载的实现相关的知识,希望对你有一定的参考价值。
概述
mapboxGl中多图标的实现可以在style中指定sprite来实现,但是在实际使用的时候会出现sprite之外的图标需要引用,此时通过map.addImage()来实现,但是如果存在多个图标的时候,因为map.addImage()需要先通过map.loadImage()先加载图标,而map.loadImage()是一个异步的,使用起来就有点麻烦。本文希望通过再再加sprite来实现一次性添加图标。
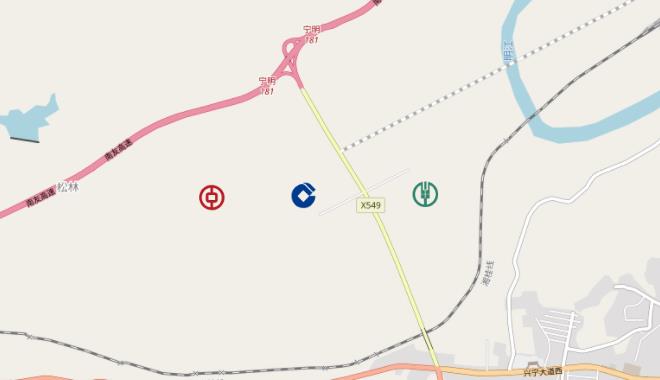
实现效果

实现
测试的sprite如下图:

json文件如下:
"zgyh":"visible":"true","pixelRatio":1,"x":0,"width":32,"y":105,"height":32,
"jsyh":"visible":"true","pixelRatio":1,"x":0,"width":32,"y":35,"height":32,
"nyyh":"visible":"true","pixelRatio":1,"x":0,"width":32,"y":70,"height":32,
"gsyh":"visible":"true","pixelRatio":1,"x":0,"width":32,"y":0,"height":32
实现代码如下:
  map.on('load',() =>
      const canvas = document.createElement('canvas')
      const ctx = canvas.getContext('2d')
      const img = new Image()
      img.src = './lib/merge.png'
      img.onload =  async () =>
        canvas.width = img.width
        canvas.height = img.height
        ctx.drawImage(img, 0, 0)
        fetch('./lib/merge.json').then(res => res.json()).then(res =>
          for (const k in res)
            const  width, height, x, y  = res[k]
            const data = ctx.getImageData(x, y, width, height).data
            map.addImage(k,  width, height, data )

          map.addSource('points',
            type: 'geojson',
            data:
              type: 'FeatureCollection',
              features: [

                  "type": "Feature",
                  "properties":  icon: 'zgyh' ,
                  "geometry":  "type": "Point", "coordinates": [107.0132554, 22.1441921]
                ,

                  "type": "Feature",
                  "properties":  icon: 'jsyh' ,
                  "geometry":  "type": "Point", "coordinates": [107.0223554, 22.1443921]
                ,

                  "type": "Feature",
                  "properties":  icon: 'nyyh' ,
                  "geometry":  "type": "Point", "coordinates": [107.0344554, 22.1444921]

              ]


          );
          map.addLayer(
            'id': 'points-h',
            'type': 'symbol',
            'source': 'points',
            'layout':
              'icon-allow-overlap': true,
              'icon-image': ['get', 'icon'],
              'icon-size': [
                "interpolate",
                [
                  "exponential",
                  1.5
                ],
                [
                  "zoom"
                ],
                5, 0.5,
                10, 0.8
              ]
            ,
          );
        )

    )
以上是关于mapboxGL中多图标加载的实现的主要内容,如果未能解决你的问题,请参考以下文章