openlayers4中闪烁点的实现
Posted 牛老师讲GIS
tags:
篇首语:本文由小常识网(cha138.com)小编为大家整理,主要介绍了openlayers4中闪烁点的实现相关的知识,希望对你有一定的参考价值。
概述:
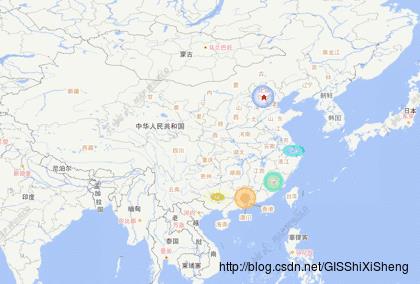
本文讲述如何在Openlayers4中实现闪烁点。
效果:

代码:
1、flash-marker.js闪烁点扩展
(function (global, factory)
    typeof exports === 'object' && typeof module !== 'undefined' ? module.exports = factory() :
        typeof define === 'function' && define.amd ? define(factory) :
            (global.FlashMarker = factory());
(this, (function ()  'use strict';

    /**
     * @author lzugis
     * @Date 2017-09-29
     * */
    function CanvasLayer(options)
        this.options = options || ;
        this.paneName = this.options.paneName || 'labelPane';
        this.zIndex = this.options.zIndex || 0;
        this._map = options.map;
        this._lastDrawTime = null;
        this.show();


    CanvasLayer.prototype.initialize = function ()
        var map = this._map;
        var canvas = this.canvas = document.createElement('canvas');
        var ctx = this.ctx = this.canvas.getContext('2d');
        canvas.style.cssText = 'position:absolute;' + 'left:0;' + 'top:0;' + 'z-index:' + this.zIndex + ';';
        this.adjustSize();
        this.adjustRatio(ctx);
        map.getViewport().appendChild(canvas);
        var that = this;
        map.getView().on('propertychange',function()
            $(canvas).hide();
        );
        map.on("moveend",function()
            $(canvas).show();
            that.adjustSize();
            that._draw();
        );
    ;

    CanvasLayer.prototype.adjustSize = function ()
        var size = this._map.getSize();
        var canvas = this.canvas;
        canvas.width = size[0];
        canvas.height = size[1];
        canvas.style.width = canvas.width + 'px';
        canvas.style.height = canvas.height + 'px';
    ;

    CanvasLayer.prototype.adjustRatio = function (ctx)
        var backingStore = ctx.backingStorePixelRatio || ctx.webkitBackingStorePixelRatio || ctx.mozBackingStorePixelRatio || ctx.msBackingStorePixelRatio || ctx.oBackingStorePixelRatio || ctx.backingStorePixelRatio || 1;
        var pixelRatio = (window.devicePixelRatio || 1) / backingStore;
        var canvasWidth = ctx.canvas.width;
        var canvasHeight = ctx.canvas.height;
        ctx.canvas.width = canvasWidth * pixelRatio;
        ctx.canvas.height = canvasHeight * pixelRatio;
        ctx.canvas.style.width = canvasWidth + 'px';
        ctx.canvas.style.height = canvasHeight + 'px';
        ctx.scale(pixelRatio, pixelRatio);
    ;

    CanvasLayer.prototype.draw = function ()
        var self = this;
        var args = arguments;

        clearTimeout(self.timeoutID);
        self.timeoutID = setTimeout(function ()
            self._draw();
        , 15);
    ;

    CanvasLayer.prototype._draw = function ()
        var map = this._map;
        var size = map.getSize();
        var center = map.getView().getCenter();
        if (center)
            var pixel = map.getPixelFromCoordinate(center);
            this.canvas.style.left = pixel[0] - size[0] / 2 + 'px';
            this.canvas.style.top = pixel[1] - size[1] / 2 + 'px';
            this.options.update && this.options.update.call(this);

    ;

    CanvasLayer.prototype.getContainer = function ()
        return this.canvas;
    ;

    CanvasLayer.prototype.show = function ()
        this.initialize();
        this.canvas.style.display = 'block';
    ;

    CanvasLayer.prototype.hide = function ()
        this.canvas.style.display = 'none';
    ;

    CanvasLayer.prototype.setZIndex = function (zIndex)
        this.canvas.style.zIndex = zIndex;
    ;

    CanvasLayer.prototype.getZIndex = function ()
        return this.zIndex;
    ;

    var global = typeof window === 'undefined' ?  : window;

    var requestAnimationFrame = global.requestAnimationFrame || global.mozRequestAnimationFrame || global.webkitRequestAnimationFrame || global.msRequestAnimationFrame || function (callback)
            return global.setTimeout(callback, 1000 / 60);
        ;

    function Marker(opts)
        this.city = opts.name;
        this.location = [opts.lnglat[0], opts.lnglat[1]];
        this.color = opts.color;
        this.type = opts.type || 'circle';
        this.speed = opts.speed || 0.15;
        this.size = 0;
        this.max = opts.max || 20;


    Marker.prototype.draw = function (context)
        context.save();
        context.beginPath();
        switch (this.type)
            case 'circle':
                this._drawCircle(context);
                break;
            case 'ellipse':
                this._drawEllipse(context);
                break;
            default:
                break;

        context.closePath();
        context.restore();

        this.size += this.speed;
        if (this.size > this.max)
            this.size = 0;

    ;

    Marker.prototype._drawCircle = function (context)
        var pixel = this.pixel||map.getPixelFromCoordinate(this.location);
        context.strokeStyle = this.color;
        context.moveTo(pixel[0] + pixel.size, pixel[1]);
        context.arc(pixel[0], pixel[1], this.size, 0, Math.PI * 2);
        context.stroke();
    ;

    Marker.prototype._drawEllipse = function (context)
        var pixel = this.pixel || map.getPixelFromCoordinate(this.location);
        var x = pixel[0],
            y = pixel[1],
            w = this.size,
            h = this.size / 2,
            kappa = 0.5522848,

            // control point offset horizontal
            ox = w / 2 * kappa,

            // control point offset vertical
            oy = h / 2 * kappa,

            // x-start
            xs = x - w / 2,

            // y-start
            ys = y - h / 2,

            // x-end
            xe = x + w / 2,

            // y-end
            ye = y + h / 2;

        context.strokeStyle = this.color;
        context.moveTo(xs, y);
        context.bezierCurveTo(xs, y - oy, x - ox, ys, x, ys);
        context.bezierCurveTo(x + ox, ys, xe, y - oy, xe, y);
        context.bezierCurveTo(xe, y + oy, x + ox, ye, x, ye);
        context.bezierCurveTo(x - ox, ye, xs, y + oy, xs, y);
        context.stroke();
    ;

    function FlashMarker(map, dataSet)
        var animationLayer = null,
            width = map.getSize()[0],
            height = map.getSize()[1],
            animationFlag = true,
            markers = [];

        var addMarker = function addMarker()
            if (markers.length > 0) return;
            markers = [];
            for (var i = 0; i < dataSet.length; i++)
                markers.push(new Marker(dataSet[i]));

        ;

        //上层canvas渲染,动画效果
        var render = function render()
            var animationCtx = animationLayer.canvas.getContext('2d');
            if (!animationCtx)
                return;


            if (!animationFlag)
                animationCtx.clearRect(0, 0, width, height);
                return;


            addMarker();

            animationCtx.fillStyle = 'rgba(0,0,0,.95)';
            var prev = animationCtx.globalCompositeOperation;
            animationCtx.globalCompositeOperation = 'destination-in';
            animationCtx.fillRect(0, 0, width, height);
            animationCtx.globalCompositeOperation = prev;

            for (var i = 0; i < markers.length; i++)
                var marker = markers[i];
                marker.draw(animationCtx);

        ;

        //初始化
        var init = function init()
            animationLayer = new CanvasLayer(
                map: map,
                update: render
            );

            (function drawFrame()
                requestAnimationFrame(drawFrame);
                render();
            )();
        ;

        init();


    return FlashMarker;

)));
2、调用展示
a、数据格式
数据个数如下:
    name: '北京',
    lnglat: ['116.3', '39.9'],
    color: '#5070FF',
    type: 'circle',
    speed: 0.2,
b、调用方法
new FlashMarker(map, citys);
----------------------------------------------------------------------------------------------
技术博客
CSDN:http://blog.csdn.NET/gisshixisheng
博客园:http://www.cnblogs.com/lzugis/
在线教程
http://edu.csdn.Net/course/detail/799
Github
https://github.com/lzugis/
联系方式
q q:1004740957
e-mail:niujp08@qq.com
公众号:lzugis15
Q Q 群:452117357(webgis)
337469080(Android)

以上是关于openlayers4中闪烁点的实现的主要内容,如果未能解决你的问题,请参考以下文章