毕业设计python+大数据构建疫情可视化分析系统
Posted DanCheng-studio
tags:
篇首语:本文由小常识网(cha138.com)小编为大家整理,主要介绍了毕业设计python+大数据构建疫情可视化分析系统相关的知识,希望对你有一定的参考价值。
文章目录
0 前言
🔥 这两年开始毕业设计和毕业答辩的要求和难度不断提升,传统的毕设题目缺少创新和亮点,往往达不到毕业答辩的要求,这两年不断有学弟学妹告诉学长自己做的项目系统达不到老师的要求。
为了大家能够顺利以及最少的精力通过毕设,学长分享优质毕业设计项目,今天要分享的是
🚩 基于python/大数据的疫情分析与可视化系统
🥇学长这里给一个题目综合评分(每项满分5分)
- 难度系数:4分
- 工作量:4分
- 创新点:3分
🧿 选题指导, 项目分享:
1 课题介绍
全球Covid-19大危机影响我们的生活,我们的出行、交流、教育、经济等都发生了巨大的变化,全球疫情大数据可视化分析与展示,可用于社会各界接入疫情数据,感知疫情相关情况的实时交互式态势,是重要的疫情分析、防控决策依据。
我国爆发的疫情,对我们的日常生活带来了极大的影响,疫情严重期间,大家都谈“疫”色变,大家对于了解疫情的情况具有巨大的需求;并且,目前来看我国仍然存在疫情二次爆发的可能,大家对于疫情的情况跟踪也急于了解。
基于这个情况,学长对疫情的数据进行了爬取和可视化的展示和疫情的追踪, 也就是学长设计的作品。
2 运行效果
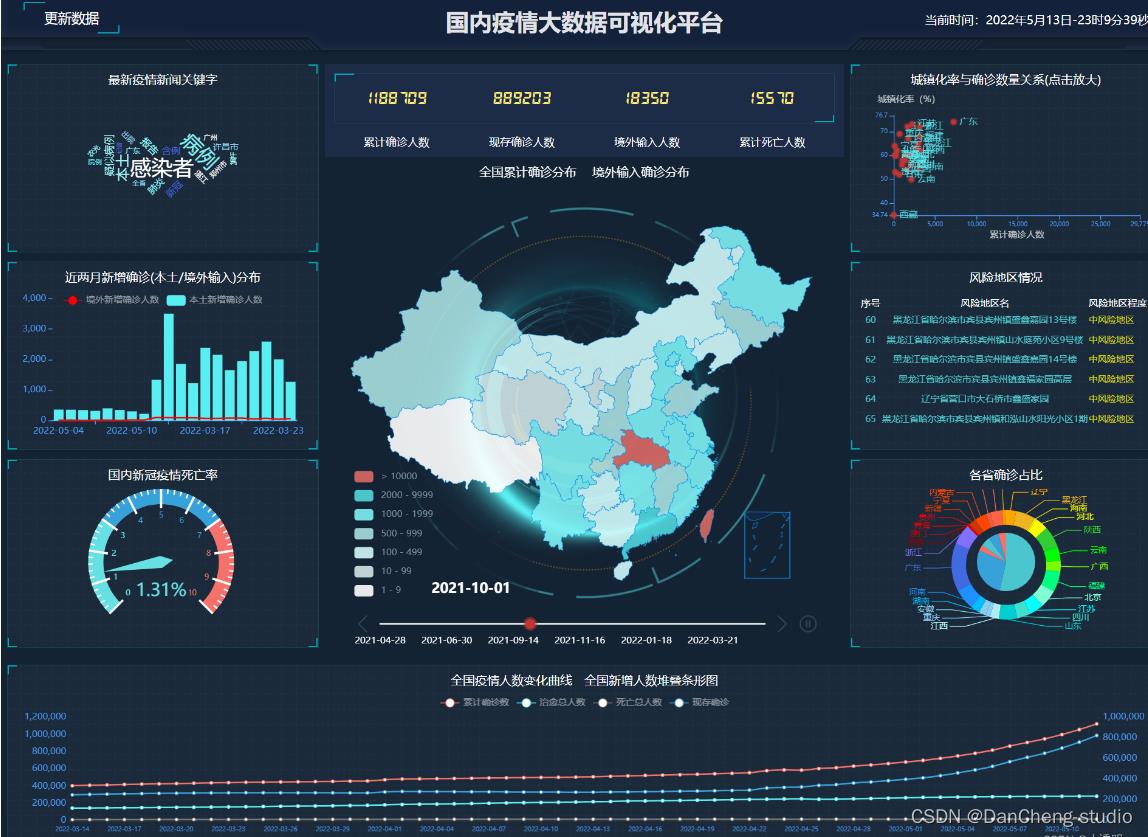
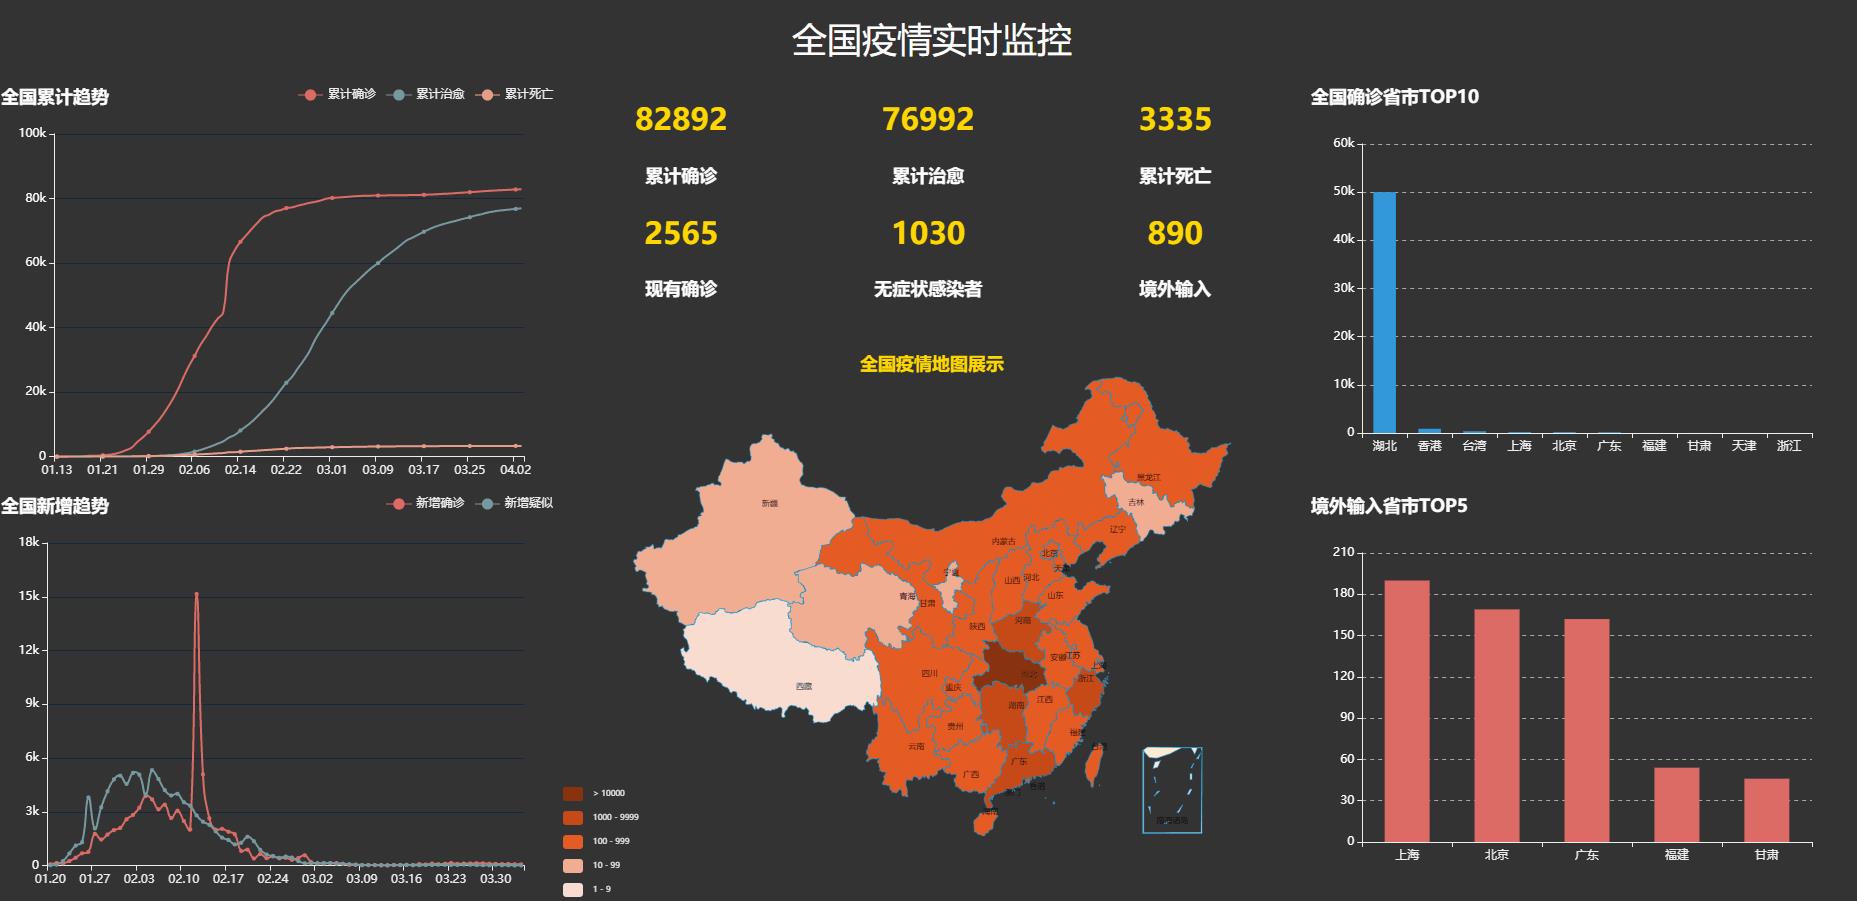
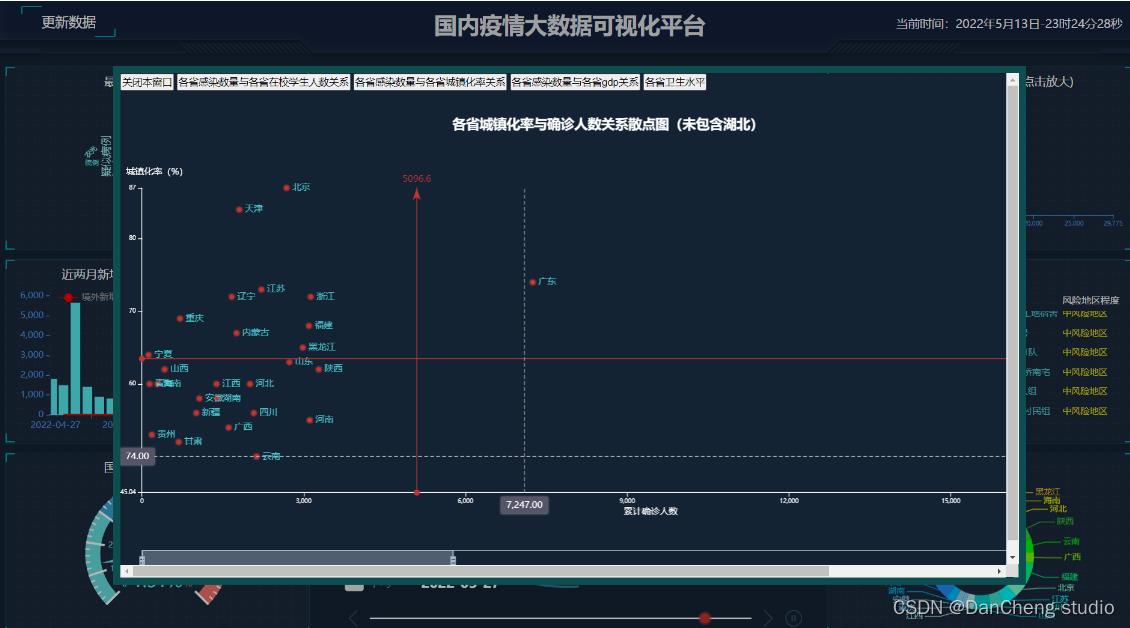
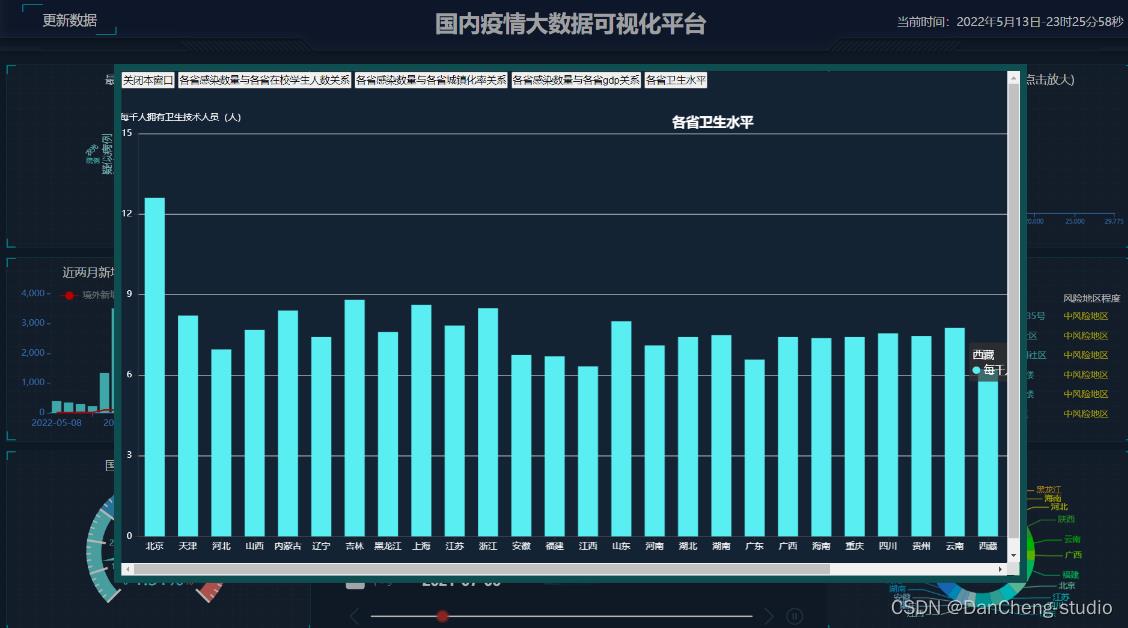
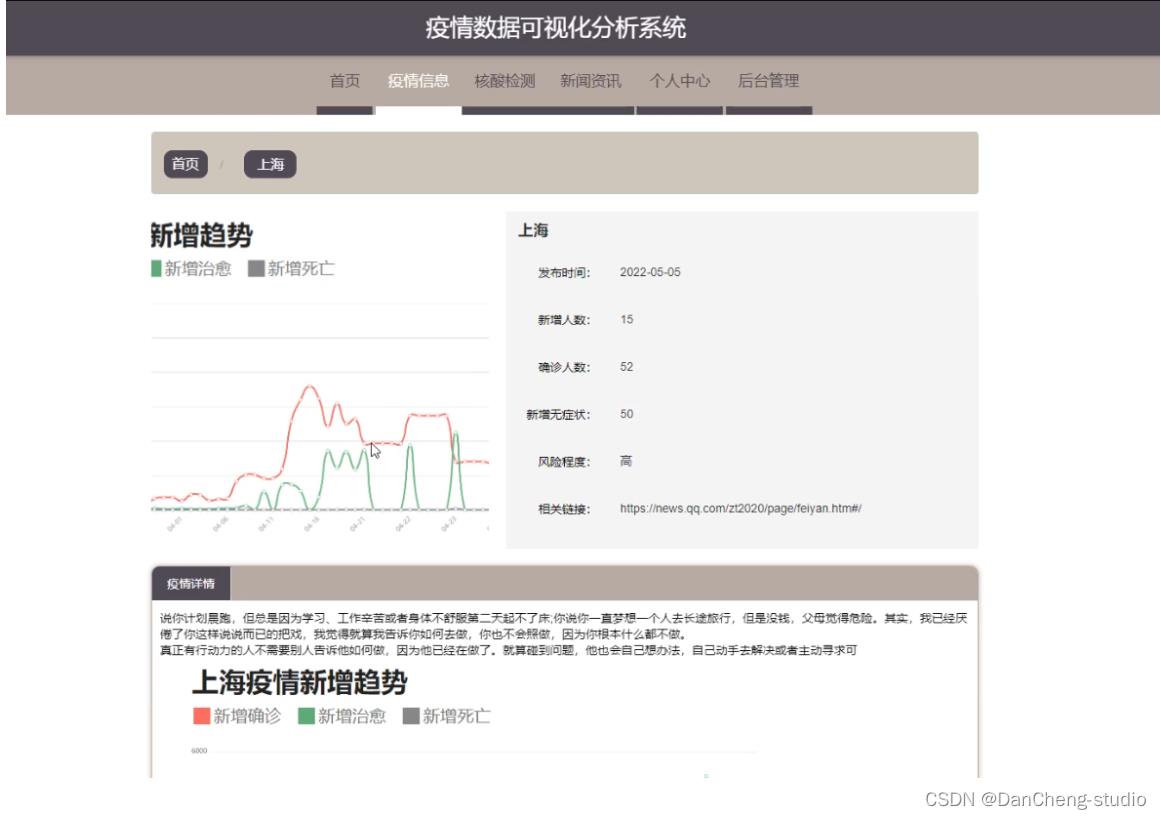
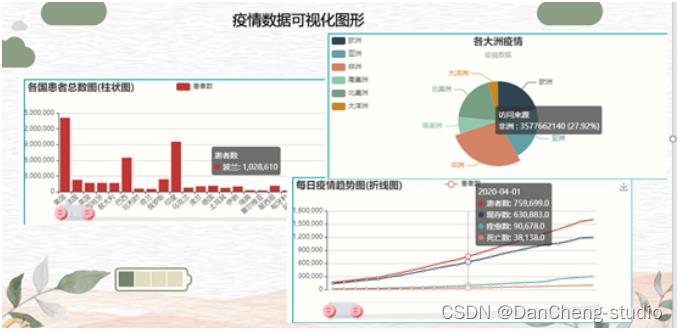
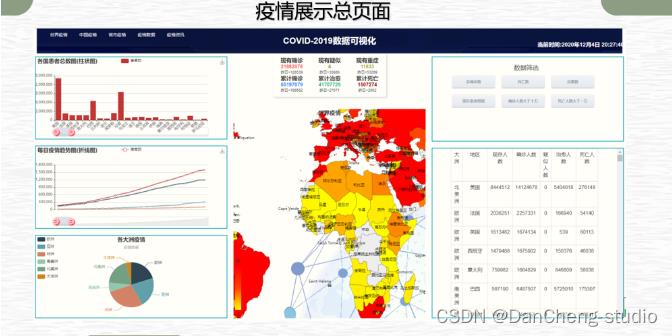
3 关键代码
PS:篇幅有限,学长仅展示部分关键代码
3.1 数据爬虫
疫情数据爬虫,就是给网站发起请求,并从响应中提取需要的数据
1、发起请求,获取响应
- 通过http库,对目标站点进行请求。等同于自己打开浏览器输入网址
- 常用库:urllib、requests
- 服务器会返回请求的内容一般为:html、文档、JSON字符串等
2、解析内容
- 寻找自己需要的信息,也就是利用正则表达式或者其他库提取目标信息
- 常用库:re、beautifulsoup4
3、保存数据
- 将解析到的数据持久化到数据库中
import pymysql
import time
import json
import traceback  #追踪异常
import requests
def get_tencent_data():
    """
    :return: 返回历史数据和当日详细数据
    """
    url = ''
    url_his=''
    #最基本的反爬虫
    headers =
        'user-agent': 'Mozilla/5.0 (Windows NT 10.0; Win64; x64) AppleWebKit/537.36 (KHTML, like Gecko) Chrome/79.0.3945.88 Safari/537.36',

    r = requests.get(url, headers)	#使用requests请求
    res = json.loads(r.text)  # json字符串转字典
    data_all = json.loads(res['data'])

    #再加上history的配套东西
    r_his=requests.get(url_his,headers)
    res_his=json.loads(r_his.text)
    data_his=json.loads(res_his['data'])

    history =   # 历史数据
    for i in data_his["chinaDayList"]:
        ds = "2020." + i["date"]
        tup = time.strptime(ds, "%Y.%m.%d")
        ds = time.strftime("%Y-%m-%d", tup)  # 改变时间格式,不然插入数据库会报错,数据库是datetime类型
        confirm = i["confirm"]
        suspect = i["suspect"]
        heal = i["heal"]
        dead = i["dead"]
        history[ds] = "confirm": confirm, "suspect": suspect, "heal": heal, "dead": dead
    for i in data_his["chinaDayAddList"]:
        ds = "2020." + i["date"]
        tup = time.strptime(ds, "%Y.%m.%d")
        ds = time.strftime("%Y-%m-%d", tup)
        confirm = i["confirm"]
        suspect = i["suspect"]
        heal = i["heal"]
        dead = i["dead"]
        history[ds].update("confirm_add": confirm, "suspect_add": suspect, "heal_add": heal, "dead_add": dead)

    details = []  # 当日详细数据
    update_time = data_all["lastUpdateTime"]
    data_country = data_all["areaTree"]  # list 25个国家
    data_province = data_country[0]["children"]  # 中国各省
    for pro_infos in data_province:
        province = pro_infos["name"]  # 省名
        for city_infos in pro_infos["children"]:
            city = city_infos["name"]
            confirm = city_infos["total"]["confirm"]
            confirm_add = city_infos["today"]["confirm"]
            heal = city_infos["total"]["heal"]
            dead = city_infos["total"]["dead"]
            details.append([update_time, province, city, confirm, confirm_add, heal, dead])
    return history, details
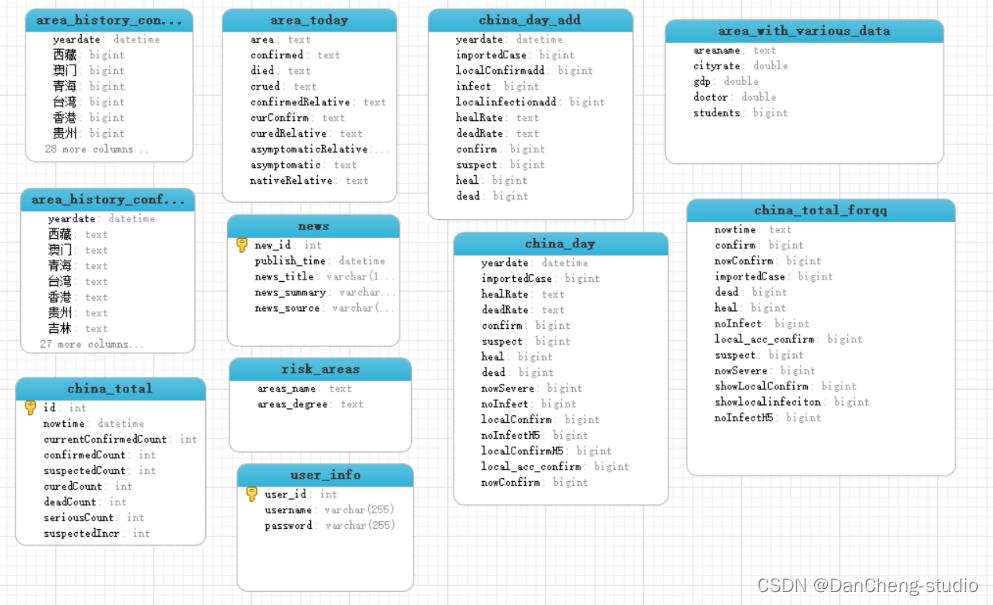
数据表结构
history表存储每日的总数据
CREATE TABLE history (
ds datetime NOT NULL COMMENT ‘日期’,
confirm int(11) DEFAULT NULL COMMENT ‘累计确诊’,
confirm_add int(11) DEFAULT NULL COMMENT ‘当日新增确诊’,
suspect int(11) DEFAULT NULL COMMENT ‘剩余疑似’,
suspect_add int(11) DEFAULT NULL COMMENT ‘当日新增疑似’,
heal int(11) DEFAULT NULL COMMENT ‘累计治愈’,
heal_add int(11) DEFAULT NULL COMMENT ‘当日新增治愈’,
dead int(11) DEFAULT NULL COMMENT ‘累计死亡’,
dead_add int(11) DEFAULT NULL COMMENT ‘当日新增死亡’,
PRIMARY KEY (ds) USING BTREE ) ENGINE=InnoDB DEFAULT CHARSET=utf8mb4;
details表存储每日的详细数据
CREATE TABLE details (
id int(11) NOT NULL AUTO_INCREMENT,
update_time datetime DEFAULT NULL COMMENT ‘数据最后更新时间’,
province varchar(50) DEFAULT NULL COMMENT ‘省’,
city varchar(50) DEFAULT NULL COMMENT ‘市’,
confirm int(11) DEFAULT NULL COMMENT ‘累计确诊’,
confirm_add int(11) DEFAULT NULL COMMENT ‘新增确诊’,
heal int(11) DEFAULT NULL COMMENT ‘累计治愈’,
dead int(11) DEFAULT NULL COMMENT ‘累计死亡’,
PRIMARY KEY (id) ) ENGINE=InnoDB DEFAULT CHARSET=utf8mb4;
整体的数据库图表:
3.2 可视化部分
echarts绘制图表
def get_c1_data():
    """
    :return: 返回大屏div id=c1 的数据
    """
    # 因为会更新多次数据,取时间戳最新的那组数据
    sql = "select sum(confirm)," \\
          "(select suspect from history order by ds desc limit 1)," \\
          "sum(heal)," \\
          "sum(dead) " \\
          "from details " \\
          "where update_time=(select update_time from details order by update_time desc limit 1) "
    res = query(sql)
    res_list = [str(i) for i in res[0]]
    res_tuple=tuple(res_list)
    return res_tuple
中国疫情地图实现
def get_c2_data():
    """
    :return:  返回各省数据
    """
    # 因为会更新多次数据,取时间戳最新的那组数据
    sql = "select province,sum(confirm) from details " \\
          "where update_time=(select update_time from details " \\
          "order by update_time desc limit 1) " \\
          "group by province"
    res = query(sql)
    return res
全国累计趋势
def get_l1_data():
	"""
	:return:返回每天历史累计数据
	"""
    sql = "select ds,confirm,suspect,heal,dead from history"
    res = query(sql)
    return res

def get_l2_data():
    """
    :return:返回每天新增确诊和疑似数据
    """
    sql = "select ds,confirm_add,suspect_add from history"
    res = query(sql)
    return res

def get_r1_data():
    """
    :return:  返回非湖北地区城市确诊人数前5名
    """
    sql = 'SELECT city,confirm FROM ' \\
          '(select city,confirm from details  ' \\
          'where update_time=(select update_time from details order by update_time desc limit 1) ' \\
          'and province not in ("湖北","北京","上海","天津","重庆") ' \\
          'union all ' \\
          'select province as city,sum(confirm) as confirm from details  ' \\
          'where update_time=(select update_time from details order by update_time desc limit 1) ' \\
          'and province in ("北京","上海","天津","重庆") group by province) as a ' \\
          'ORDER BY confirm DESC LIMIT 5'
    res = query(sql)
    return res
疫情热搜
def get_r2_data():
    """
    :return:  返回最近的20条热搜
    """
    sql = 'select content from hotsearch order by id desc limit 20'
    res = query(sql)  # 格式 (('民警抗疫一线奋战16天牺牲1037364',), ('四川再派两批医疗队1537382',)
    return res
🧿 选题指导, 项目分享:
4 最后
以上是关于毕业设计python+大数据构建疫情可视化分析系统的主要内容,如果未能解决你的问题,请参考以下文章