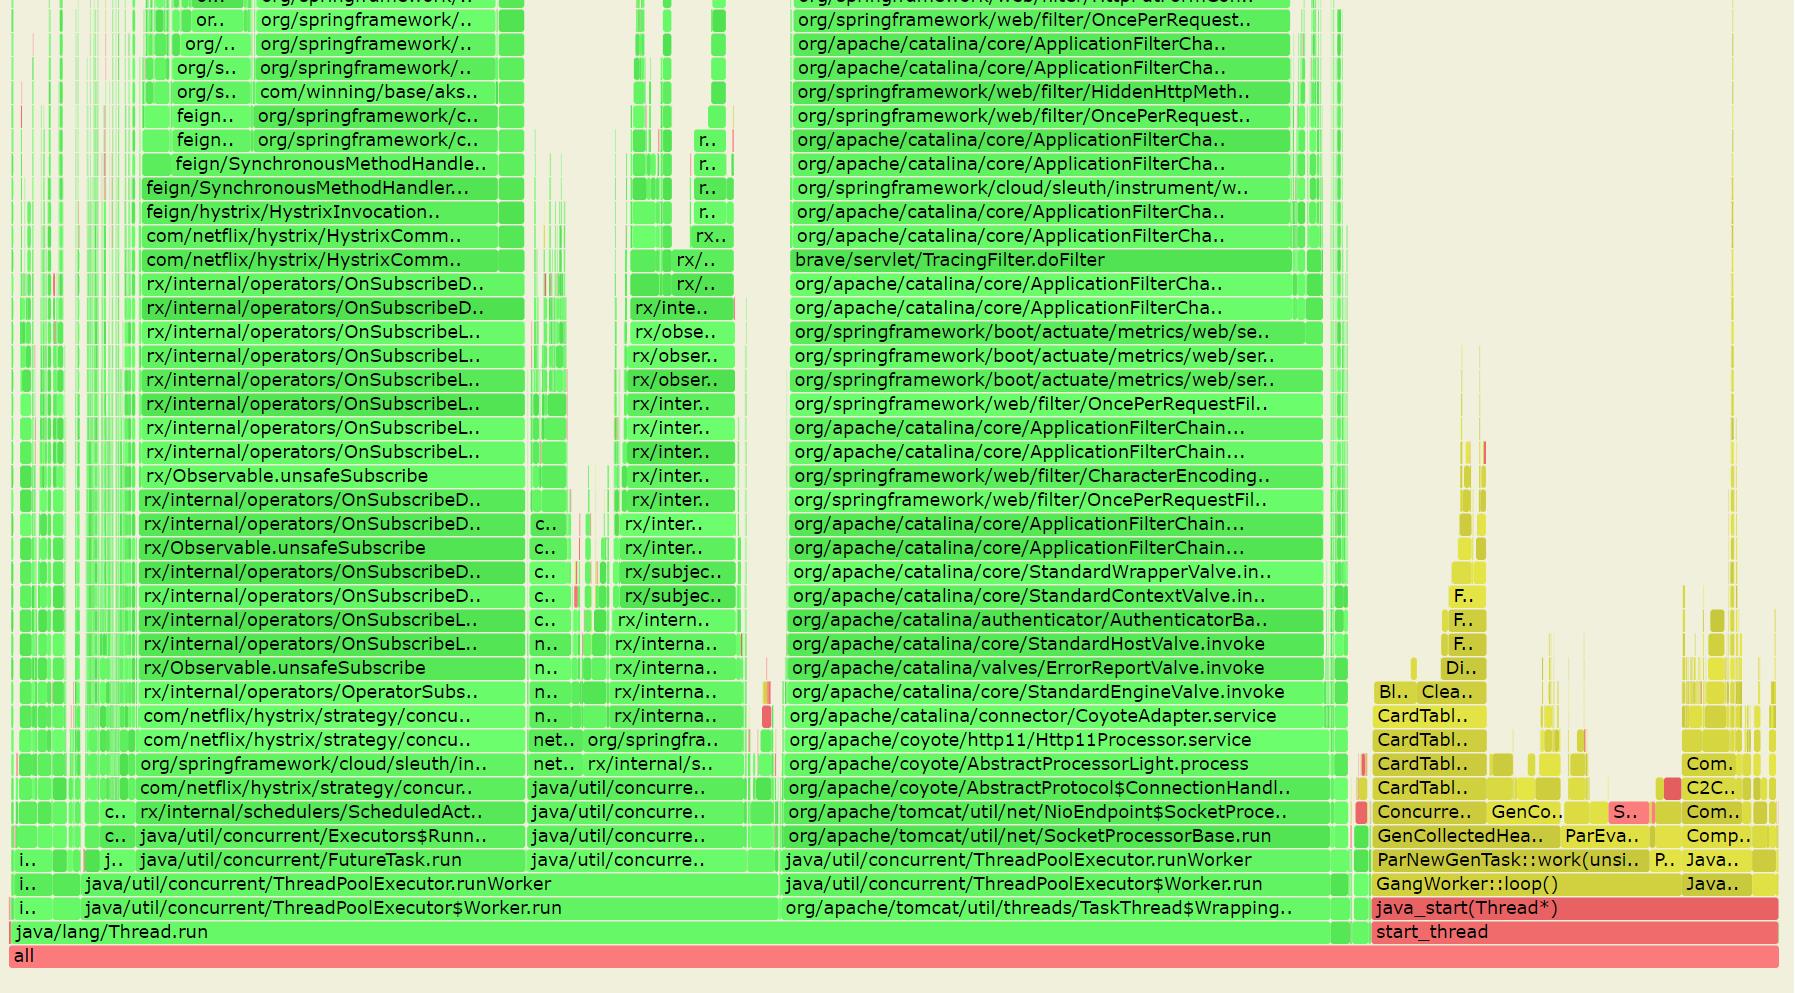
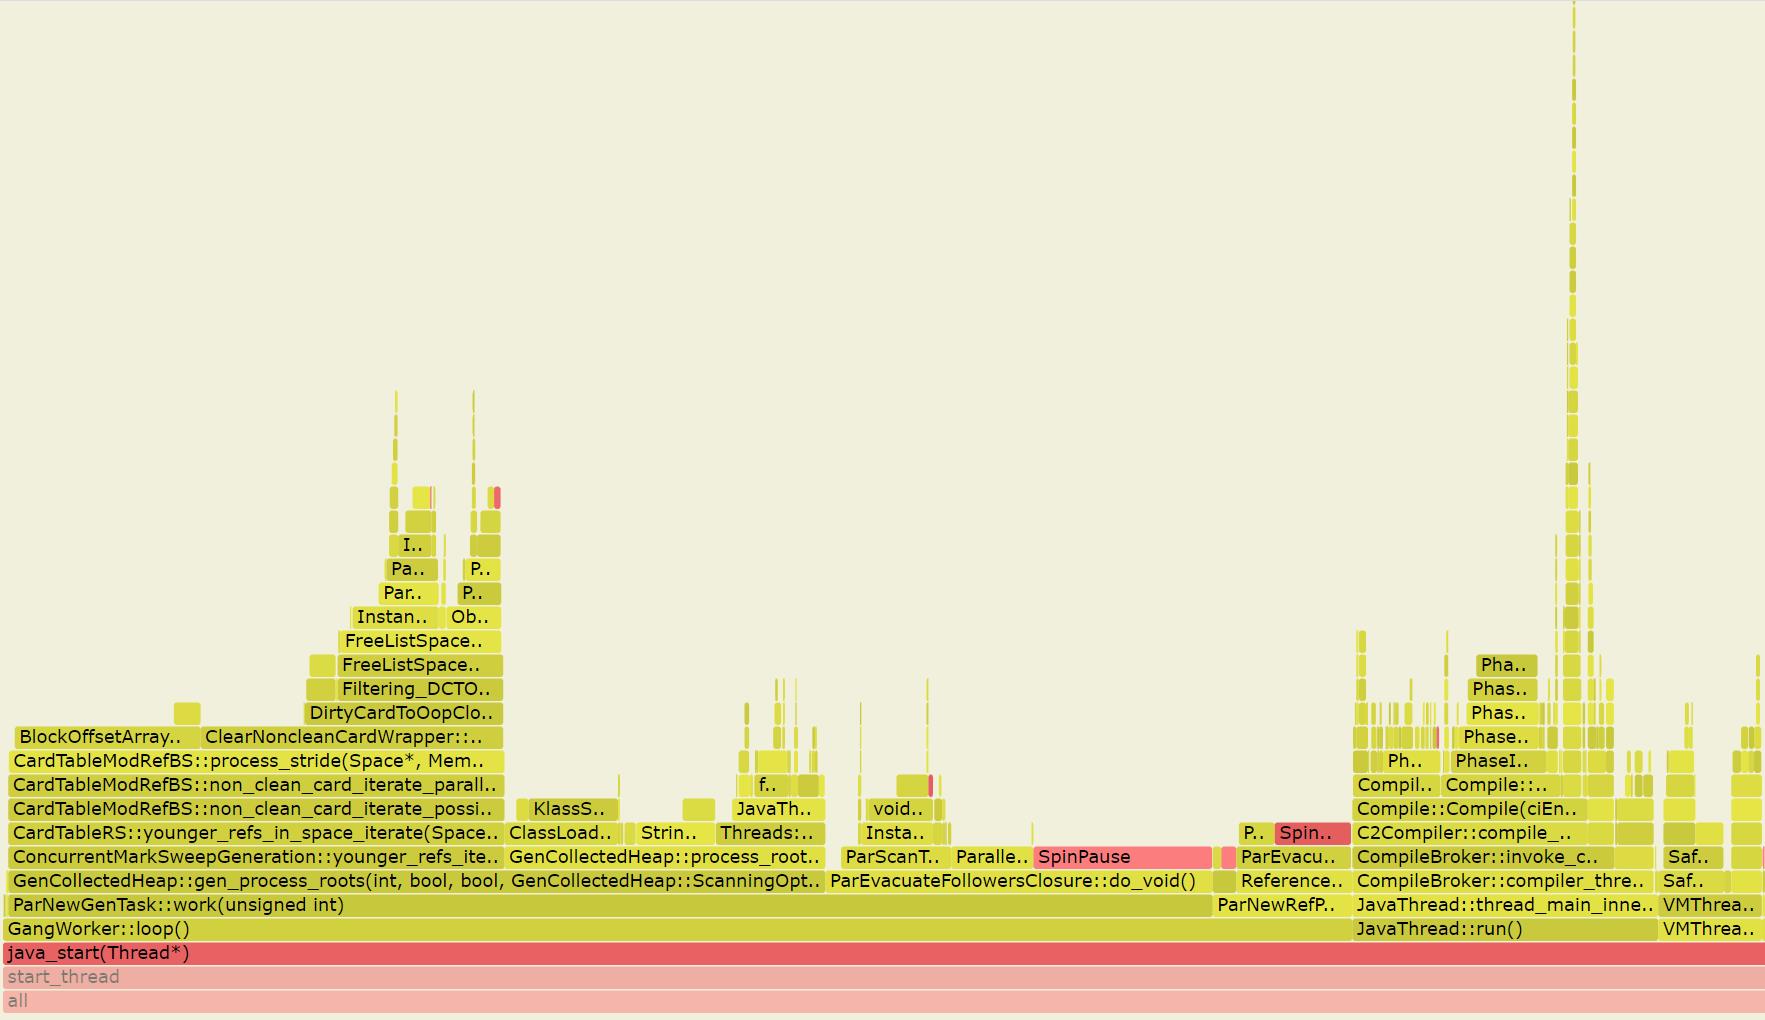
使用arthas采集火焰图
Posted 21aspnet
tags:
篇首语:本文由小常识网(cha138.com)小编为大家整理,主要介绍了使用arthas采集火焰图相关的知识,希望对你有一定的参考价值。
火焰图是用图形化的方式来展现profiler工具采集的性能数据,对数据进行统计和分析,方便找出性能热点。
现在我们使用arthas采集JVM的火焰图。
1.首先你需要安装arthas
说是安装其实就是下载解压,arthas是不需要安装的。
需要完整的文件目录例如:

需要注意 如果你只是上传一个arthas-boot.jar是不够的,因为会调用其他库
#unzip arthas-packaging-3.5.4-bin.zip
#java -jar /home/profiler/arthas/arthas-boot.jar
2.启动arthas
先查你的Java进程id,查Java进程可以通过
#jps -l
启动arthas
#java -jar /home/profiler/arthas/arthas-boot.jar
定位到你需要的Java进程,输入你的Java进程id
$ profiler start
Started [cpu] profiling
$ profiler getSamples
25
$ profiler status
[perf] profiling is running for 21 seconds
$ profiler stop --format html
OK
输出文件格式
profiler stop --format html --file /home/profiler/arthas/20211230-1540.html
推荐输出图像格式
profiler stop --format svg --file /home/profiler/arthas/20211231-1111-atms.svg

点开性能损耗严重的地方可以看放大的详情图

JVM那点事—火焰图(flame graph)性能分析 - 简书
以上是关于使用arthas采集火焰图的主要内容,如果未能解决你的问题,请参考以下文章