Elasticsearch:使用 Elasticsearch categorize_text 聚合对日志进行分类
Posted Elastic 中国社区官方博客
tags:
篇首语:本文由小常识网(cha138.com)小编为大家整理,主要介绍了Elasticsearch:使用 Elasticsearch categorize_text 聚合对日志进行分类相关的知识,希望对你有一定的参考价值。

作为一名前系统管理员,我个人对 categorize_text 对探索日志的意义感到兴奋。 这种新的 Elasticsearch 功能是我希望在那些日子里拥有的东西。 花费大量时间筛选大量日志以找出令人不安的模式。 categorize_text 在查询时将流行的日志模式带到最前沿。 此功能与 Elasticsearch 已经广泛且强大的聚合框架相结合,可缩短获取信息的时间。 探索成山的日志变得更加容易。 在 Kibana 中自动集群日志、计算统计数据和可视化是任何 SRE 或管理员的有力工具。
categorize_text 聚合是如何工作?
categorize_text 从文档 _source 读取文本并使用自定义 tokenizer ml_standard 创建 tokenizer,该 tokenizer 专门为一般机器生成的文本构建。 事实上,异常检测中提供的许多相同选项在 categorize_text 中可用。 分析文本后,将使用 DRAIN 算法的修改版本将 token 聚集在一起。 DRAIN 构建一个 token 树并认为较早的 token 更重要。 我们稍微修改了算法,以允许在构建类别时合并文本中较早的token。 本质上,具有高可变性的 token 被删除,而更一致的 token 形成类别定义。
文本分类示例
以下是 categorize_text 解析以下 nginx 日志行的方式。
"message": "2018/11/26 18:09:45 [error] 8#8: *4781 open() \\"/etc/nginx/html/wan.php\\" failed (2: No such file or directory), client: 154.91.201.90, server: _, request: \\"POST /wan.php HTTP/1.1\\", host: \\"35.246.148.213\\"",
"message": "2018/11/20 17:26:36 [error] 8#8: *3672 open() \\"/etc/nginx/html/pe.php\\" failed (2: No such file or directory), client: 139.159.210.222, server: _, request: \\"POST /pe.php HTTP/1.1\\", host: \\"35.246.148.213\\""
使用默认设置,它将成为以下类别:
error open * failed No such file or directory client server request * host公共 token 包含在类别定义中,变量 token(在这种情况下为 url 文件路径)用 * 值省略。
既然我们知道它在高层次上是如何工作的,那么它怎么能被使用呢?
可视化日志类别的示例
让我们研究 categorize_text 聚合的三个用例,它们可以帮助你作为系统管理员:随时间按类别识别问题、显示最常见的错误类别和类别趋势可视化。 以下示例均使用 Kibana Vega 在查询时可视化日志类别。
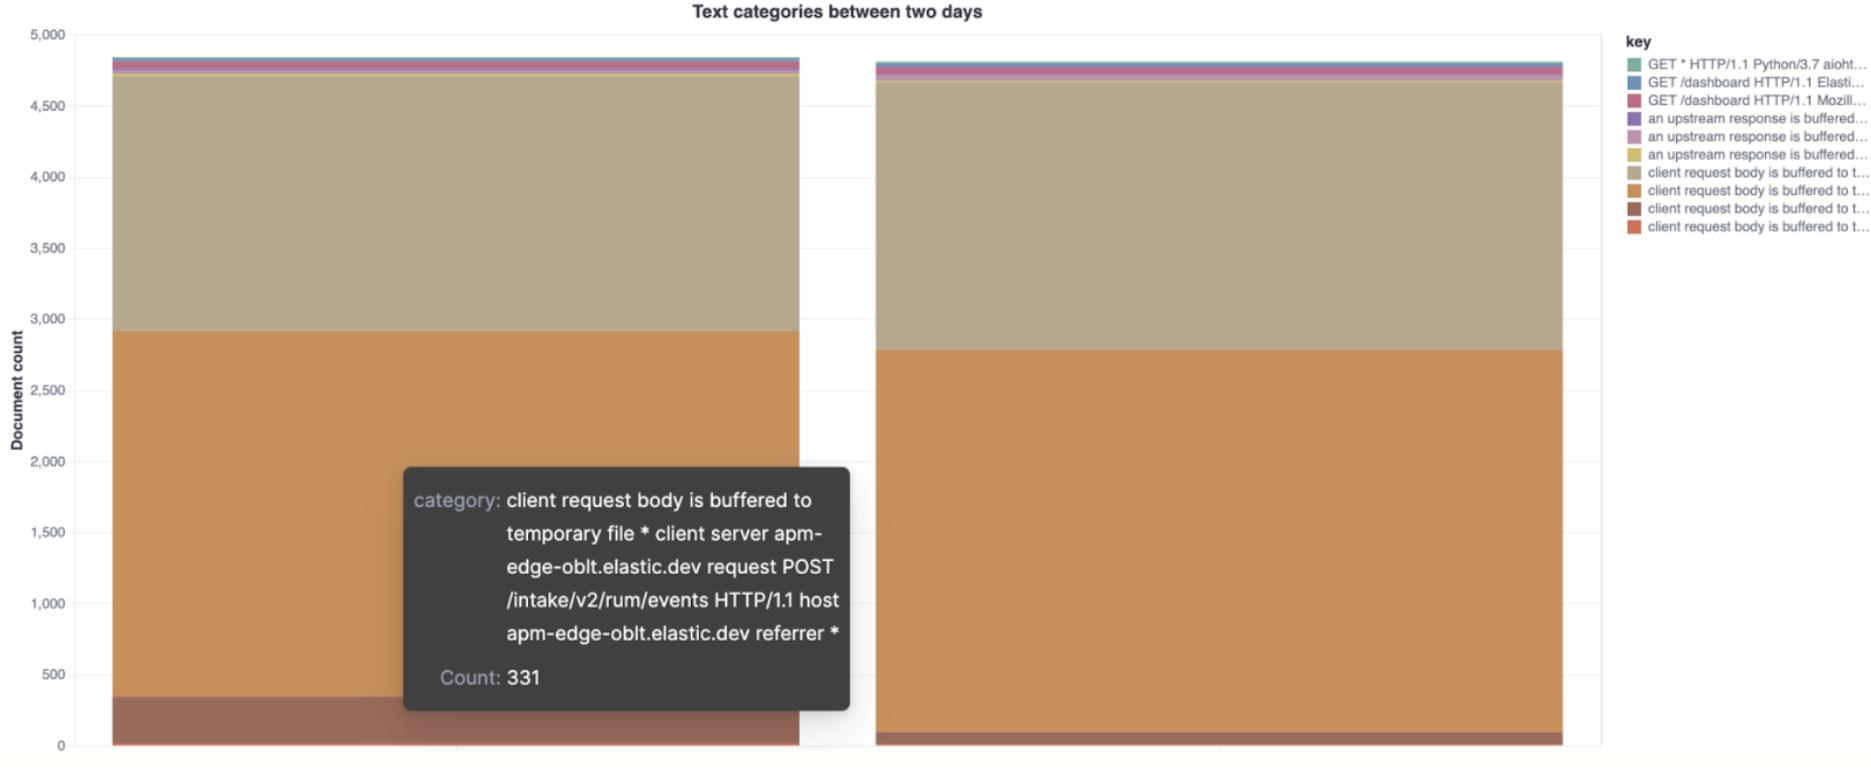
比较不同日期的顶级类别
以下示例显示了两天内 NGINX 错误的不同顶级类别。 在将之前已知的 “好日子” 与系统行为不稳定的日子进行比较时,这很有用。

  "$schema": "https://vega.github.io/schema/vega-lite/v5.json",
  "title": "Text categories between two days",
  "data":
    "url":
      "index": "filebeat-*",
      "body":
        "size": 0,
        "query":
          "bool":
            "filter": [
              "term": "event.dataset": "nginx.error",

                "bool":
                  "should": [

                      "range":
                        "@timestamp":
                          "gte": "2021-02-25T00:00:00.000Z",
                          "lte": "2021-02-25T12:00:00.000Z"


                    ,

                      "range":
                        "@timestamp":
                          "gte": "2021-02-26T00:00:00.000Z",
                          "lte": "2021-02-26T12:00:00.000Z"


                  ],
                  "minimum_should_match": 1


            ]

        ,
        "aggs":
          "sample":
            "sampler": "shard_size": 5000,
            "aggs":
              "categories":
                "categorize_text":
                  "field": "message",
                  "similarity_threshold": 20,
                  "max_unique_tokens": 20
                ,
                "aggs":
                  "time_buckets":
                    "filters":
                      "filters":
                        "first":
                          "range":
                            "@timestamp":
                              "gte": "2021-02-25T00:00:00.000Z",
                              "lte": "2021-02-25T12:00:00.000Z"


                        ,
                        "second":
                          "range":
                            "@timestamp":
                              "gte": "2021-02-26T00:00:00.000Z",
                              "lte": "2021-02-26T12:00:00.000Z"


    ,
    "format": "property": "aggregations.sample.categories.buckets"
  ,
  "transform": [

      "fold": [
        "time_buckets.buckets.first.doc_count",
        "time_buckets.buckets.second.doc_count"
      ],
      "as": ["subKey", "subValue"]

  ],
  "mark": "bar",
  "encoding":
    "x": "field": "subKey", "type": "ordinal", "axis": "title": null,
    "y":
      "field": "subValue",
      "type": "quantitative",
      "axis": "title": "Document count"
    ,
    "color": "field": "key",
    "tooltip": [
      "field": "key", "type": "nominal", "title": "category",
      "field": "subValue", "type": "quantitative", "title": "Count"
    ]
  ,
  "layer": ["mark": "bar", "encoding": "color": "field": "key"]
如果你对如何使用 Vega 来进行可视化还不是很了解的话,请参阅文章 “Kibana:Vega 可视化入门 - 定制自己的可视化图”。
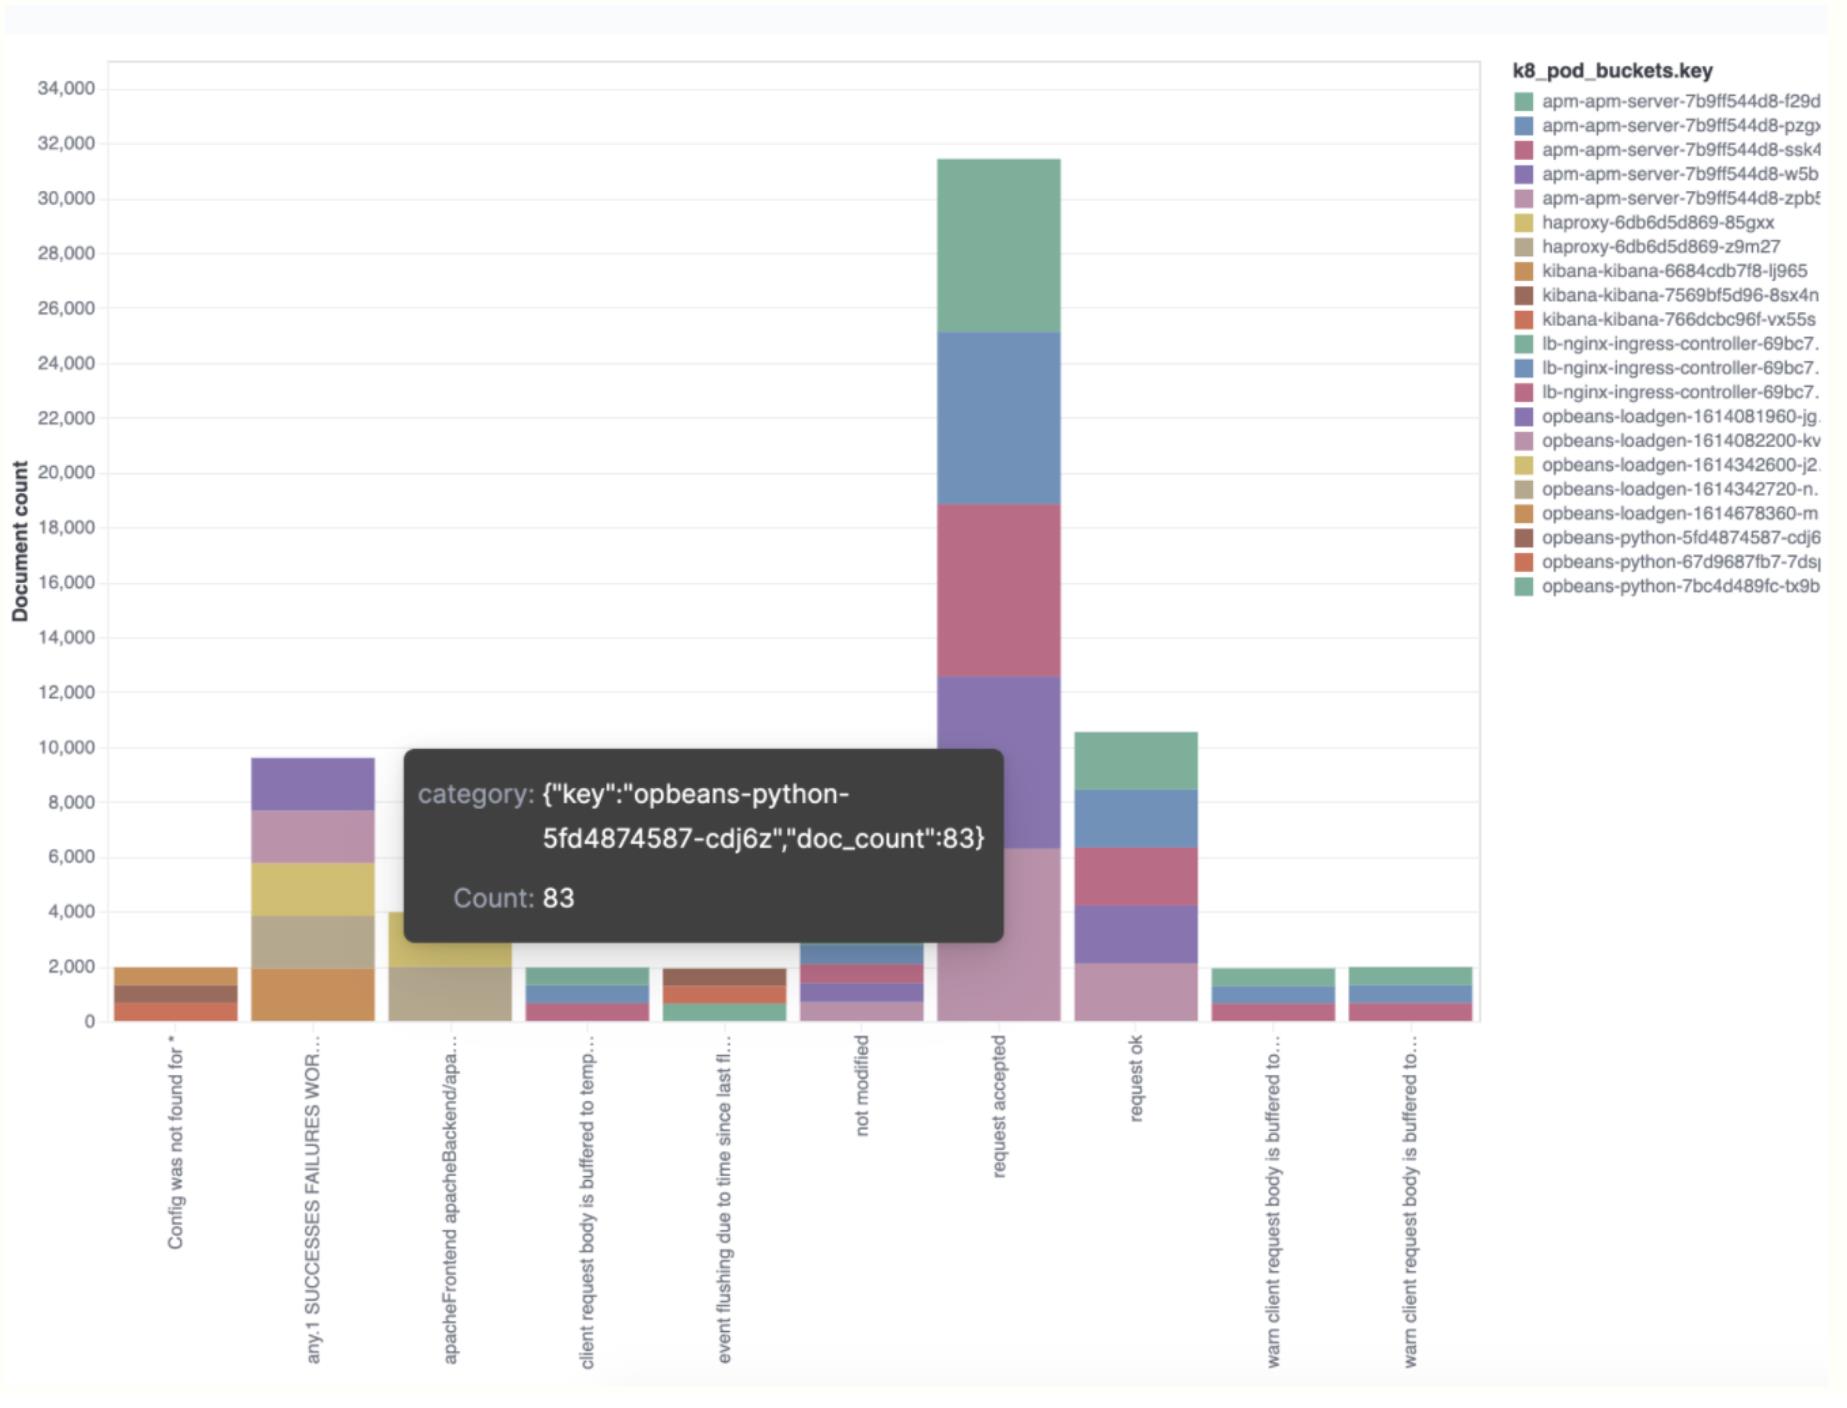
通过术语聚合收集顶级类别
此术语聚合示例显示了每个类别中哪些术语值最普遍。 在这种特殊情况下,
Kubernetes pod 是使用的术语。

  "$schema": "https://vega.github.io/schema/vega-lite/v5.json",
  "title": "Event counts from all indexes",
  "data":
    "url":
      "%context%": true,
      "%timefield%": "@timestamp",
      "index": "filebeat-8.0.0-*",
      "body":
        "aggs":
          "sample":
            "sampler": "shard_size": 5000,
            "aggs":
              "categories":
                "categorize_text":
                  "field": "message",
                  "similarity_threshold": 20,
                  "max_unique_tokens": 20
                ,
                "aggs":
                  "k8_pod":
                    "terms": "field": "kubernetes.pod.name", "size": 5


        ,
        "size": 0

    ,
    "format": "property": "aggregations.sample.categories.buckets"
  ,
  "transform": [
    "flatten": ["k8_pod.buckets"], "as": ["k8_pod_buckets"]
  ],
  "mark": "bar",
  "encoding":
    "x": "field": "key", "type": "ordinal", "axis": "title": false,
    "y":
      "field": "doc_count",
      "type": "quantitative",
      "axis": "title": "Document count"
    ,
    "color": "field": "k8_pod_buckets.key",
    "tooltip": [
      "field": "k8_pod_buckets",
      "type": "nominal",
      "title": "category"
    ,
      "field": "k8_pod_buckets.doc_count",
      "type": "quantitative",
      "title": "Count"
    ]
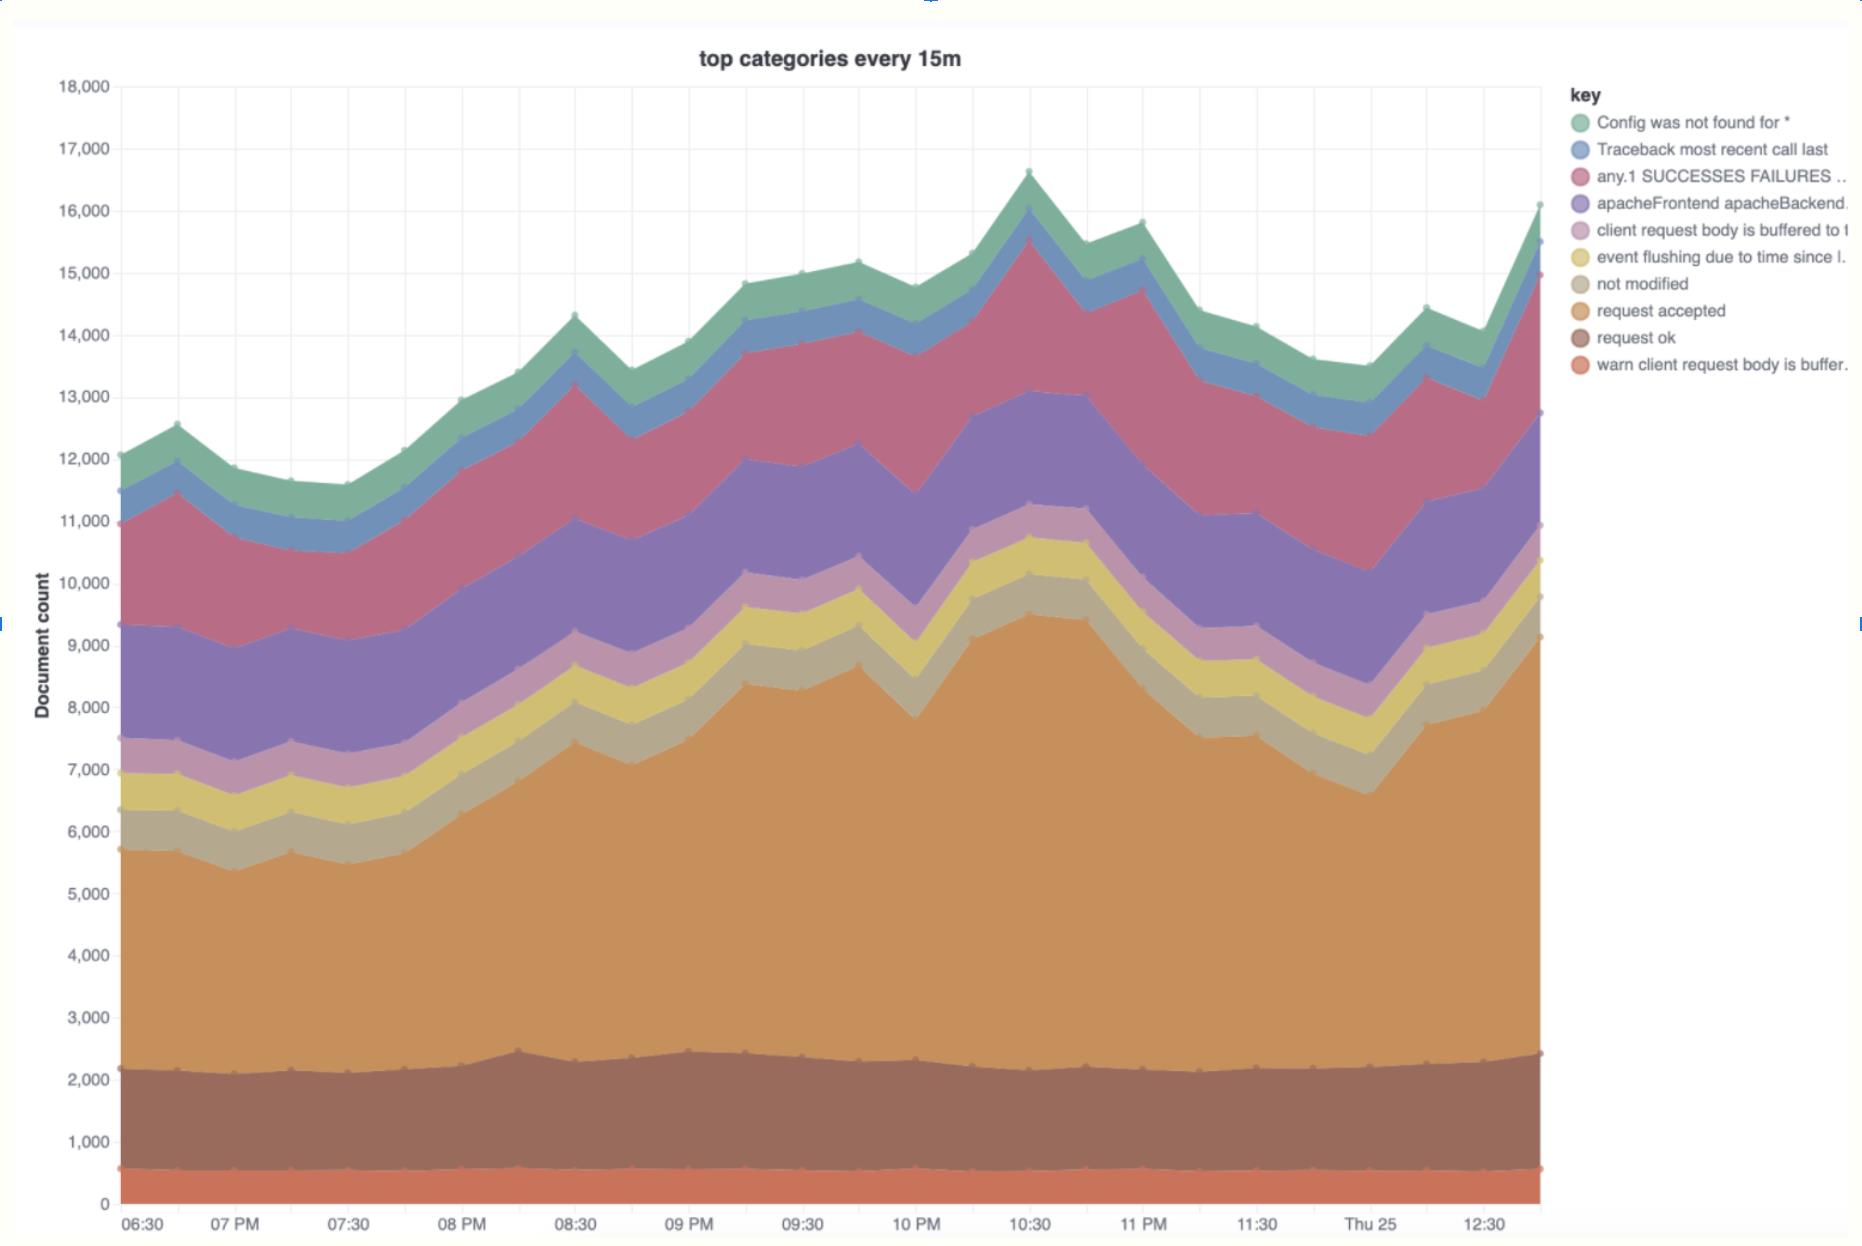
随着时间的推移可视化类别趋势
此分析可用于探索奇怪的日志记录峰值,并帮助确定哪些类别对峰值的贡献最大。

  "$schema": "https://vega.github.io/schema/vega-lite/v5.json",
  "title": "top categories every 15m",
  "data":
    "url":
      "%context%": true,
      "%timefield%": "@timestamp",
      "index": "filebeat-8.0.0-*",
      "body":
        "aggs":
          "categories":
            "categorize_text":
              "field": "message",
              "similarity_threshold": 20,
              "max_unique_tokens": 20
            ,
            "aggs":
              "time_buckets":
                "date_histogram":
                  "field": "@timestamp",
                  "interval": "15m",
                  "min_doc_count": 1


        ,
        "size": 0

    ,
    "format": "property": "aggregations.categories.buckets"
  ,
  "transform": ["flatten": ["time_buckets.buckets"], "as": ["buckets"]],
  "mark": "area",
  "encoding":
    "tooltip": [
      "field": "buckets.key", "type": "temporal", "title": "Date",
      "field": "key", "type": "nominal", "title": "Category",
      "field": "buckets.doc_count", "type": "quantitative", "title": "Count"
    ],
    "x": "field": "buckets.key", "type": "temporal", "axis": "title": "category",
    "y":
      "field": "buckets.doc_count",
      "type": "quantitative",
      "stack": true,
      "axis": "title": "Document count"
    ,
    "color": "field": "key", "type": "nominal"
  ,
  "layer": [
    "mark": "area",

      "mark": "point",
      "selection":
        "pointhover":
          "type": "single",
          "on": "mouseover",
          "clear": "mouseout",
          "empty": "none",
          "fields": ["buckets.key", "key"],
          "nearest": true

      ,
      "encoding":
        "size":
          "condition": "selection": "pointhover", "value": 100,
          "value": 5
        ,
        "fill": "condition": "selection": "pointhover", "value": "white"


  ]
试试看
这些示例只是 7.16 技术预览版中发布的 categorize_text 聚合的开始。 对机器生成的文本进行分类和 Elasticsearch 中强大的聚合框架为你提供了大量的日志和数据探索机会。 立即启动 Elastic Cloud 集群并试一试。 我们很想听听你的反馈——在我们的讨论论坛或社区 Slack 频道中加入有关 Elastic 机器学习的对话。
更多阅读:Elasticsearch:使用 categorize text aggregation 来创建更好的警报
以上是关于Elasticsearch:使用 Elasticsearch categorize_text 聚合对日志进行分类的主要内容,如果未能解决你的问题,请参考以下文章