Cesium剖面分析(仿火星科技)
Posted hpugisers
tags:
篇首语:本文由小常识网(cha138.com)小编为大家整理,主要介绍了Cesium剖面分析(仿火星科技)相关的知识,希望对你有一定的参考价值。
剖面分析是三维分析的一种,仅在地形图状态下方可使用。作为一个测绘人员剖面分析,大多在地形的状态下高程变化,本文采用Ceisum和echart结合,下面讲解剖面分析的实现过程。
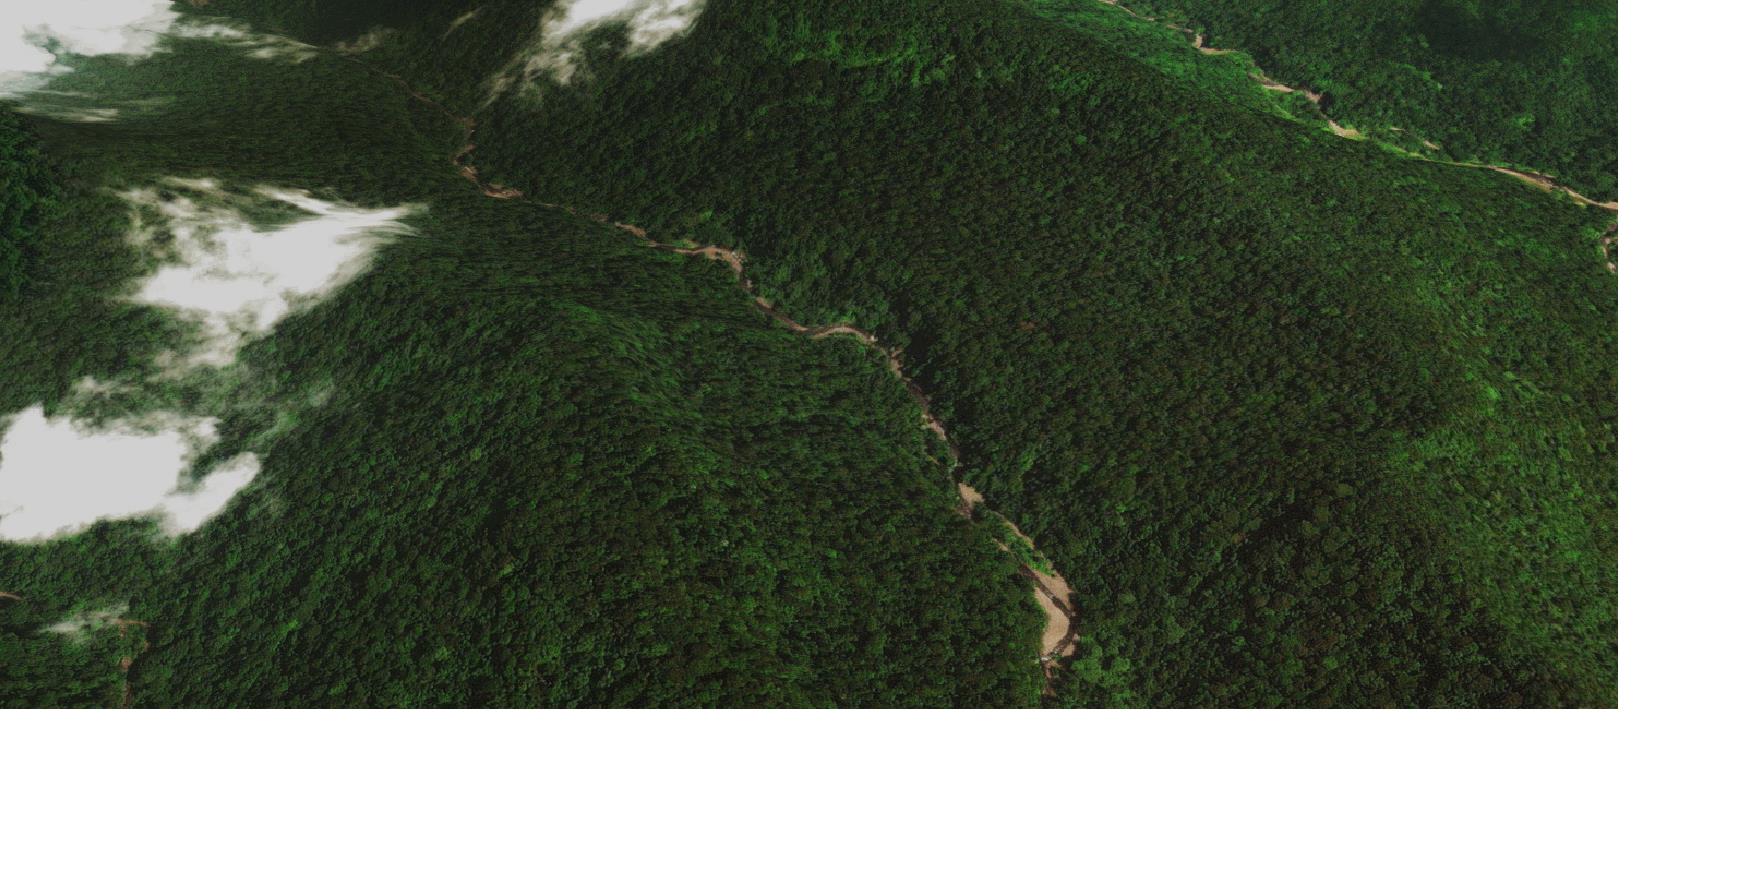
效果图:
 一、实现原理
1、根据点击事件绘制剖面线段(贴地形),并获取start、end两点,为线段空间插值做数据准备,采用viewer.scene.pickPosition(click.position);
2、线段插值,线段插值采用var cart = Cesium.Cartesian3.lerp(start, end, i / count, new Cesium.Cartesian3());
3、将插值的数据,赋值给chartData
二、主要函数
1、剖面分析函数封装
function profileAnalyse(start, end)
            var startPoint = Cesium.Cartographic.fromCartesian(start);
            var endPoint = Cesium.Cartographic.fromCartesian(end);
            profile.arrLX.push(0);
            profile.ponits.push(startPoint);
            profile.arrPoint.push(getDegrees(startPoint));
            profile.arrHB.push(startPoint.height);
            // 插值100个点,点越多模拟越精确,但是效率会低
            var count = 100;
            for (var i = 1; i < count; i++)
                var cart = Cesium.Cartesian3.lerp(start, end, i / count, new Cesium.Cartesian3());
                var cartographicCart = Cesium.Cartographic.fromCartesian(cart);
                var disc = distance(profile.ponits[i - 1], cartographicCart);
                profile.distance = profile.distance + disc;
                profile.ponits.push(cartographicCart);
                profile.arrLX.push(profile.arrLX[i - 1] + disc);

                profile.arrPoint.push(getDegrees(cart));
                profile.arrHB.push(cartographicCart.height);

            profile.ponits.push(endPoint);
            profile.arrLX.push(profile.arrLX[profile.arrLX.length - 1] + distance(profile.ponits[profile.ponits.length-1], endPoint));
            profile.arrPoint.push(getDegrees(endPoint));
            profile.arrHB.push(endPoint.height);
            return profile;
2、设置Echart数据函数封装
function setEchartsData(e)
if (null != e && null != e.arrPoint)
$("#sectionChars").show(),
null == myChart && (myChart = echarts.init(document.getElementById("echartsView1"), "dark"));
console.log(e.arrHB.value);
var t = e.arrPoint,
chartData =
grid:
left: 10,
right: 10,
bottom: 10,
containLabel: !0
,
dataZoom: [
type: "inside",
throttle: 50
],
tooltip:
trigger: "axis",
formatter: function (e)
var a = "";
if (0 == e.length) return a;
e[0].value;
console.log(e);
var r = t[e[0].dataIndex];
console.log(r);
return a += "所在位置 " + strFormat(r.x ) + "," + strFormat(r.y ) + "<br />距起点 <label>" + haoutil.str.formatLength(e[0].axisValue) + "</label><br />" + e[0].seriesName + " <label style='color:" + e[0].color + ";'>" + haoutil.str.formatLength(e[0].value) + "</label><br />"
,
xAxis: [
name: "行程",
type: "category",
boundaryGap: !1,
axisLine:
show: !1
,
axisLabel:
show: !1
,
data: e.arrLX
],
yAxis: [
type: "value",
axisLabel:
rotate: 60,
formatter: "value 米"
],
series: [
name: "高程值",
type: "line",
smooth: !0,
symbol: "none",
sampling: "average",
itemStyle:
normal:
color: "rgb(255, 70, 131)"
,
areaStyle:
normal:
color: new echarts.graphic.LinearGradient(0, 0, 0, 1, [
offset: 0,
color: "rgb(255, 158, 68)"
,
offset: 1,
color: "rgb(255, 70, 131)"
])
,
data: e.arrHB
]
;
myChart.setOption(chartData)
三、完整demo
<!DOCTYPE html>
<html>
<head>
<meta charset="utf-8" />
<title>剖面分析</title>
<link href="../script/Cesium-1.56.1/Build/Cesium/Widgets/widgets.css" rel="stylesheet" />
<script src="../script/Cesium-1.56.1/Build/Cesium/Cesium.js"></script>
<script src="../../Scripts/jquery-3.3.1.min.js"></script>
<script src="../js/haoutil.js"></script>
<script src="../../Scripts/incubator-echarts-master/dist/echarts.min.js"></script>
<link href="../css/style.css" rel="stylesheet" />
<style>
.sectionChars
top: auto;
width: 90%;
height: 200px;
bottom: 10px;
left: 5%;
top: auto;
bottom: 10px;
display: none
</style>
</head>
<body>
<div id="sectionChars" class="infoview sectionChars">
<div id="echartsView1" style="width:100%;height:100%"></div>
</div>
<div id="container"></div>
<script>
Cesium.Ion.defaultAccessToken = ' ';
//创建地形图层
var rectangle = new Cesium.Rectangle(Cesium.Math.toRadians(5.9993076), Cesium.Math.toRadians(-0.00025749207),
Cesium.Math.toRadians(7.00078), Cesium.Math.toRadians(1.001215));
var terrainLayer = new Cesium.CesiumTerrainProvider(
url: 'http://localhost:9002/api/wmts/terrain/671bf0e4425e421a8fbe701e2b4db959',
requestWaterMask: true,
credit: 'http://www.bjxbsj.cn',
);
//创建容器
var viewer = new Cesium.Viewer('container',
selectionIndicator: false,
infoBox: false,
terrainProvider: terrainLayer
);
viewer.scene.globe.depthTestAgainstTerrain = true;
//定位到目标地形
viewer.scene.camera.flyTo( destination: rectangle );
//取消左键双击事件
viewer.cesiumWidget.screenSpaceEventHandler.removeInputAction(Cesium.ScreenSpaceEventType.LEFT_DOUBLE_CLICK);
//具体事件的实现
var ellipsoid = viewer.scene.globe.ellipsoid;
var handler = new Cesium.ScreenSpaceEventHandler(viewer.canvas);
var start, end;
var profile =
arrHB: [],
arrPoint: [],
arrLX: [],
ponits: [],
distance: 0
;
var myChart;
var draw = function (drawingMode)
var entityPolygon = null;
var points = null;
//取消左键双击事件
viewer.cesiumWidget.screenSpaceEventHandler.removeInputAction(Cesium.ScreenSpaceEventType.LEFT_DOUBLE_CLICK);
//淹没分析entity
function createPoint(worldPosition)
var point = viewer.entities.add(
position: worldPosition,
point:
pixelSize: 10,
color: Cesium.Color.YELLOW,
//disableDepthTestDistance: Number.POSITIVE_INFINITY,
heightReference: Cesium.HeightReference.CLAMP_TO_GROUND
,
);
points = point;
return point;
var drawingMode = drawingMode;
function drawShape(positionData)
var shape;
if (drawingMode === 'line')
shape = viewer.entities.add(
polyline:
positions: positionData,
clampToGround: true,
arcType: Cesium.ArcType.RHUMB,
material: Cesium.Color.GREEN,
width: 5,
//zIndex:1
//,show:false
);
else if (drawingMode === 'polygon')
shape = viewer.entities.add(
polygon:
hierarchy: positionData,
material: new Cesium.ColorMaterialProperty(Cesium.Color.LIGHTSKYBLUE.withAlpha(0.7))
);
return shape;
var activeShapePoints = [];
var activeShape;
var floatingPoint;
handler.setInputAction(function (event)
if (!Cesium.Entity.supportsPolylinesOnTerrain(viewer.scene))
console.log('This browser does not support polylines on terrain.');
return;
// 使用viewer.scene.pickPosition` 来代替`viewer.camera.pickEllipsoid` 这样当鼠标掠过terrain能得到正确的坐标
var earthPosition = viewer.scene.pickPosition(event.position);
if (Cesium.defined(earthPosition))
if (activeShapePoints.length === 0)
start = earthPosition;
floatingPoint = createPoint(earthPosition);
activeShapePoints.push(earthPosition);
var dynamicPositions = new Cesium.CallbackProperty(function ()
return activeShapePoints;
, false);
activeShape = drawShape(dynamicPositions);
//计算距离并且进行叠加
profile.distance = profile.distance + distance(activeShapePoints[activeShapePoints.length - 1], earthPosition);
activeShapePoints.push(earthPosition);
createPoint(earthPosition);
, Cesium.ScreenSpaceEventType.LEFT_CLICK);
handler.setInputAction(function (event)
if (Cesium.defined(floatingPoint))
var newPosition = viewer.scene.pickPosition(event.endPosition);
if (Cesium.defined(newPosition))
floatingPoint.position.setValue(newPosition);
activeShapePoints.pop();
activeShapePoints.push(newPosition);
, Cesium.ScreenSpaceEventType.MOUSE_MOVE);
function terminateShape()
activeShapePoints.pop();
entityPolygon = drawShape(activeShapePoints);
viewer.entities.remove(floatingPoint);
viewer.entities.remove(activeShape);
entityPolygon = null;
floatingPoint = undefined;
activeShape = undefined;
activeShapePoints = [];
handler.setInputAction(function (event)
var length = activeShapePoints.length - 1;
end = activeShapePoints[length];
var data = profileAnalyse(start, end);
console.log(data);
setEchartsData(data);
terminateShape();
, Cesium.ScreenSpaceEventType.RIGHT_CLICK);
//剖面分析
function profileAnalyse(start, end)
var startPoint = Cesium.Cartographic.fromCartesian(start);
var endPoint = Cesium.Cartographic.fromCartesian(end);
profile.arrLX.push(0);
profile.ponits.push(startPoint);
profile.arrPoint.push(getDegrees(startPoint));
profile.arrHB.push(startPoint.height);
// 插值100个点,点越多模拟越精确,但是效率会低
var count = 100;
for (var i = 1; i < count; i++)
var cart = Cesium.Cartesian3.lerp(start, end, i / count, new Cesium.Cartesian3());
var cartographicCart = Cesium.Cartographic.fromCartesian(cart);
var disc = distance(profile.ponits[i - 1], cartographicCart);
profile.distance = profile.distance + disc;
profile.ponits.push(cartographicCart);
profile.arrLX.push(profile.arrLX[i - 1] + disc);
profile.arrPoint.push(getDegrees(cart));
profile.arrHB.push(cartographicCart.height);
profile.ponits.push(endPoint);
profile.arrLX.push(profile.arrLX[profile.arrLX.length - 1] + distance(profile.ponits[profile.ponits.length-1], endPoint));
profile.arrPoint.push(getDegrees(endPoint));
profile.arrHB.push(endPoint.height);
return profile;
//计算两点间的距离
function distance(point1, point2)
//var point1cartographic = Cesium.Cartographic.fromCartesian(point1);
//var point2cartographic = Cesium.Cartographic.fromCartesian(point2);
/**根据经纬度计算出距离**/
var geodesic = new Cesium.EllipsoidGeodesic();
geodesic.setEndPoints(point1, point2);
var s = geodesic.surfaceDistance;
//返回两点之间的距离
s = Math.sqrt(Math.pow(s, 2) + Math.pow(point2.height - point1.height, 2));
return s;
//世界坐标转换为经纬度
function getDegrees(cart)
var cartographic = ellipsoid.cartesianToCartographic(cart);
var lat = Cesium.Math.toDegrees(cartographic.latitude);
var lng = Cesium.Math.toDegrees(cartographic.longitude);
var alt = cartographic.height;
return x:lng,y:lat,z:alt;
//经纬度保留两位小数
function strFormat(str)
var strString = str.toString();
var strs = strString.slice(0, strString.indexOf(".")+3);
return strs;
//设置Echart数据
function setEchartsData(e)
if (null != e && null != e.arrPoint)
$("#sectionChars").show(),
null == myChart && (myChart = echarts.init(document.getElementById("echartsView1"), "dark"));
console.log(e.arrHB.value);
var t = e.arrPoint,
chartData =
grid:
left: 10,
right: 10,
bottom: 10,
containLabel: !0
,
dataZoom: [
type: "inside",
throttle: 50
],
tooltip:
trigger: "axis",
formatter: function (e)
var a = "";
if (0 == e.length) return a;
e[0].value;
console.log(e);
var r = t[e[0].dataIndex];
console.log(r);
return a += "所在位置 " + strFormat(r.x ) + "," + strFormat(r.y ) + "<br />距起点 <label>" + haoutil.str.formatLength(e[0].axisValue) + "</label><br />" + e[0].seriesName + " <label style='color:" + e[0].color + ";'>" + haoutil.str.formatLength(e[0].value) + "</label><br />"
,
xAxis: [
name: "行程",
type: "category",
boundaryGap: !1,
axisLine:
show: !1
,
axisLabel:
show: !1
,
data: e.arrLX
],
yAxis: [
type: "value",
axisLabel:
rotate: 60,
formatter: "value 米"
],
series: [
name: "高程值",
type: "line",
smooth: !0,
symbol: "none",
sampling: "average",
itemStyle:
normal:
color: "rgb(255, 70, 131)"
,
areaStyle:
normal:
color: new echarts.graphic.LinearGradient(0, 0, 0, 1, [
offset: 0,
color: "rgb(255, 158, 68)"
,
offset: 1,
color: "rgb(255, 70, 131)"
])
,
data: e.arrHB
]
;
myChart.setOption(chartData)
draw('line');
</script>
</body>
</html>
四、参考博文
1、https://xiaozhuanlan.com/topic/2108573649
2、https://blog.csdn.net/qq_34149805/article/details/78393540
3、https://blog.csdn.net/u013517229/article/details/84563952
4、http://cesium.marsgis.cn/cesium-example/editor.html#42_measure_section
以上是关于Cesium剖面分析(仿火星科技)的主要内容,如果未能解决你的问题,请参考以下文章