DataV构建大屏(全屏)数据展示页面
Posted 梨遇
tags:
篇首语:本文由小常识网(cha138.com)小编为大家整理,主要介绍了DataV构建大屏(全屏)数据展示页面相关的知识,希望对你有一定的参考价值。
官方文档地址:DataV
1.安装组件库
- npm安装
npm install @jiaminghi/data-view
2.使用
全局引入
// 将自动注册所有组件为全局组件
import dataV from '@jiaminghi/data-view'
Vue.use(dataV)
按需引入
按需引入仅支持基于ES module的tree shaking,按需引入示例如下:
import  borderBox1  from '@jiaminghi/data-view'
Vue.use(borderBox1)
3.实现
(1)全屏容器
全屏容器可以根据屏幕比例及当前浏览器窗口大小,自动进行缩放处理。浏览器全屏后,全屏容器将充满屏幕。
<dv-full-screen-container>content</dv-full-screen-container>注意:使用前请注意将body的margin设为0,否则会引起计算误差,全屏后不能完全充满屏幕。
(2)边框
官方文档中给出了边框的使用以及使用效果。
所有边框均支持自定义颜色及背景色,方法如下
<dv-border-box-1 :color="['#0DFFF1','#0E466C']" backgroundColor="blue">dv-border-box-1</dv-border-box-1>(3)loading加载
<dv-loading>Loading...</dv-loading>
(4)装饰
SVG元素绘制,增强视觉效果,官方文档中有使用效果
所有装饰均支持自定义颜色,方法如下
<dv-decoration-1 :color="['red', 'green']" />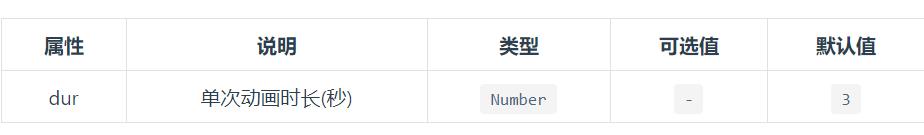
(5)图表
图表组件基于Charts封装,只需要将对应图表option数据传入组件即可。
<dv-charts :option="option" />
(6)动态环图
基于Charts封装。
<dv-active-ring-chart :config="config" style="width:300px;height:300px" />
具体属性详见官方文档动态环图 | DataV
(7) 胶囊柱图
<dv-capsule-chart :config="config" style="width:300px;height:200px" />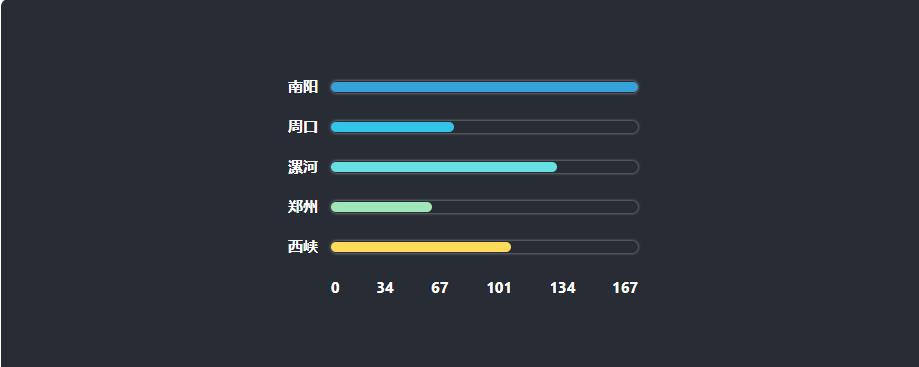
具体属性详见官方文档胶囊柱图 | DataV
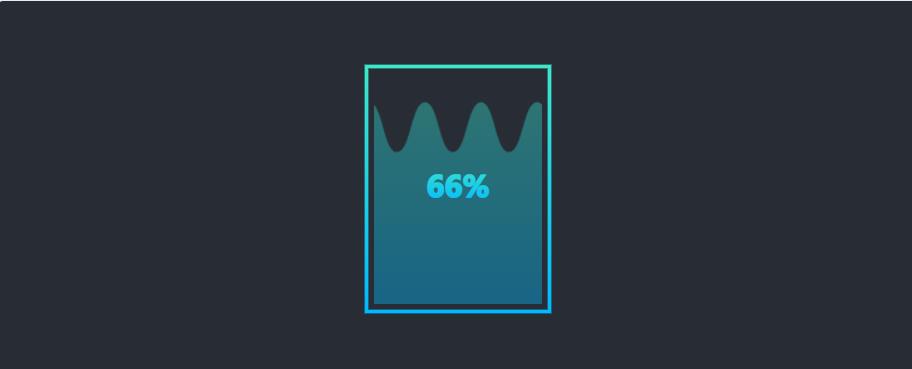
(8) 水位图
<dv-water-level-pond :config="config" style="width:150px;height:200px" />config数据
export default
  data: [66]
config数据
export default
  data: [66, 45],
  shape: 'roundRect'
 config数据
export default
  data: [55],
  shape: 'round'
 (9) 进度池
<dv-percent-pond :config="config" style="width:200px;height:100px;" /> 具体属性详见官方文档进度池 | DataV
(10)飞线图
设置一个中心点,若干飞线点,即可得到动态飞线图,组件提供的dev模式可以帮你快速配置飞线点位置。
<dv-flyline-chart :config="config" style="width:100%;height:100%;" />
具体开启dev模式及属性详见官方文档飞线图 | DataV
(11)锥形柱图
锥形柱图是特殊的柱状图,他将根据数值大小,降序排列锥形柱,适合排名类数据展示
<dv-conical-column-chart :config="config" style="width:400px;height:200px;" />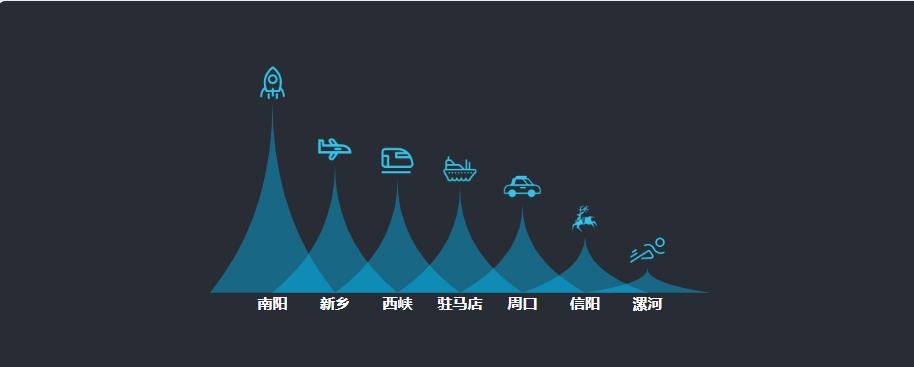 (12)数字翻牌器
<dv-digital-flop :config="config" style="width:200px;height:50px;" />const config1 =
number: [100],
content: 'nt个'
const config2 =
number: [999],
content: 'nt个'
export default [
config1,
config2
]
具体属性详见官方文档数字翻牌器 | DataV
(13) 轮播表
轮播表可以单条轮播也可以整页轮播,支持点击事件,展示数据使用v-html渲染,因此你可以传递html字符串,定制个性化元素
<dv-scroll-board :config="config" style="width:500px;height:220px" />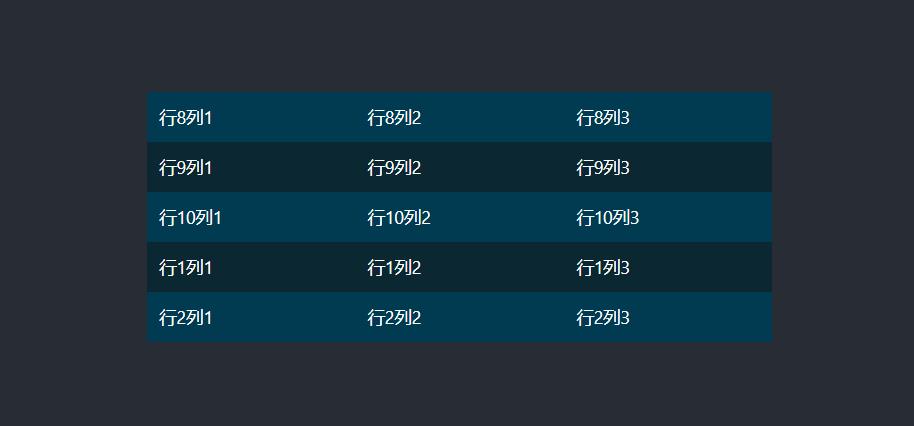
具体属性详见官方文档轮播表 | DataV
(14) 排名轮播表
排名轮播表同轮播表类似,也可以选择单条轮播或整页轮播。
<dv-scroll-ranking-board :config="config" style="width:500px;height:300px" />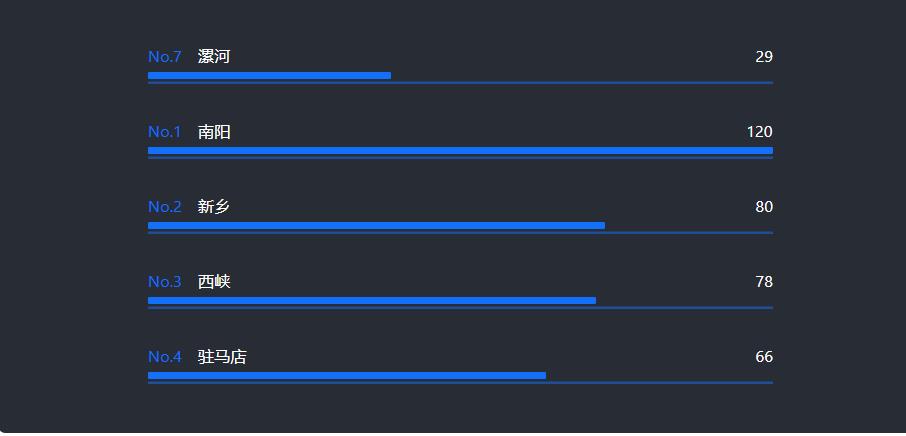
具体属性详见官方文档排名轮播表 | DataV
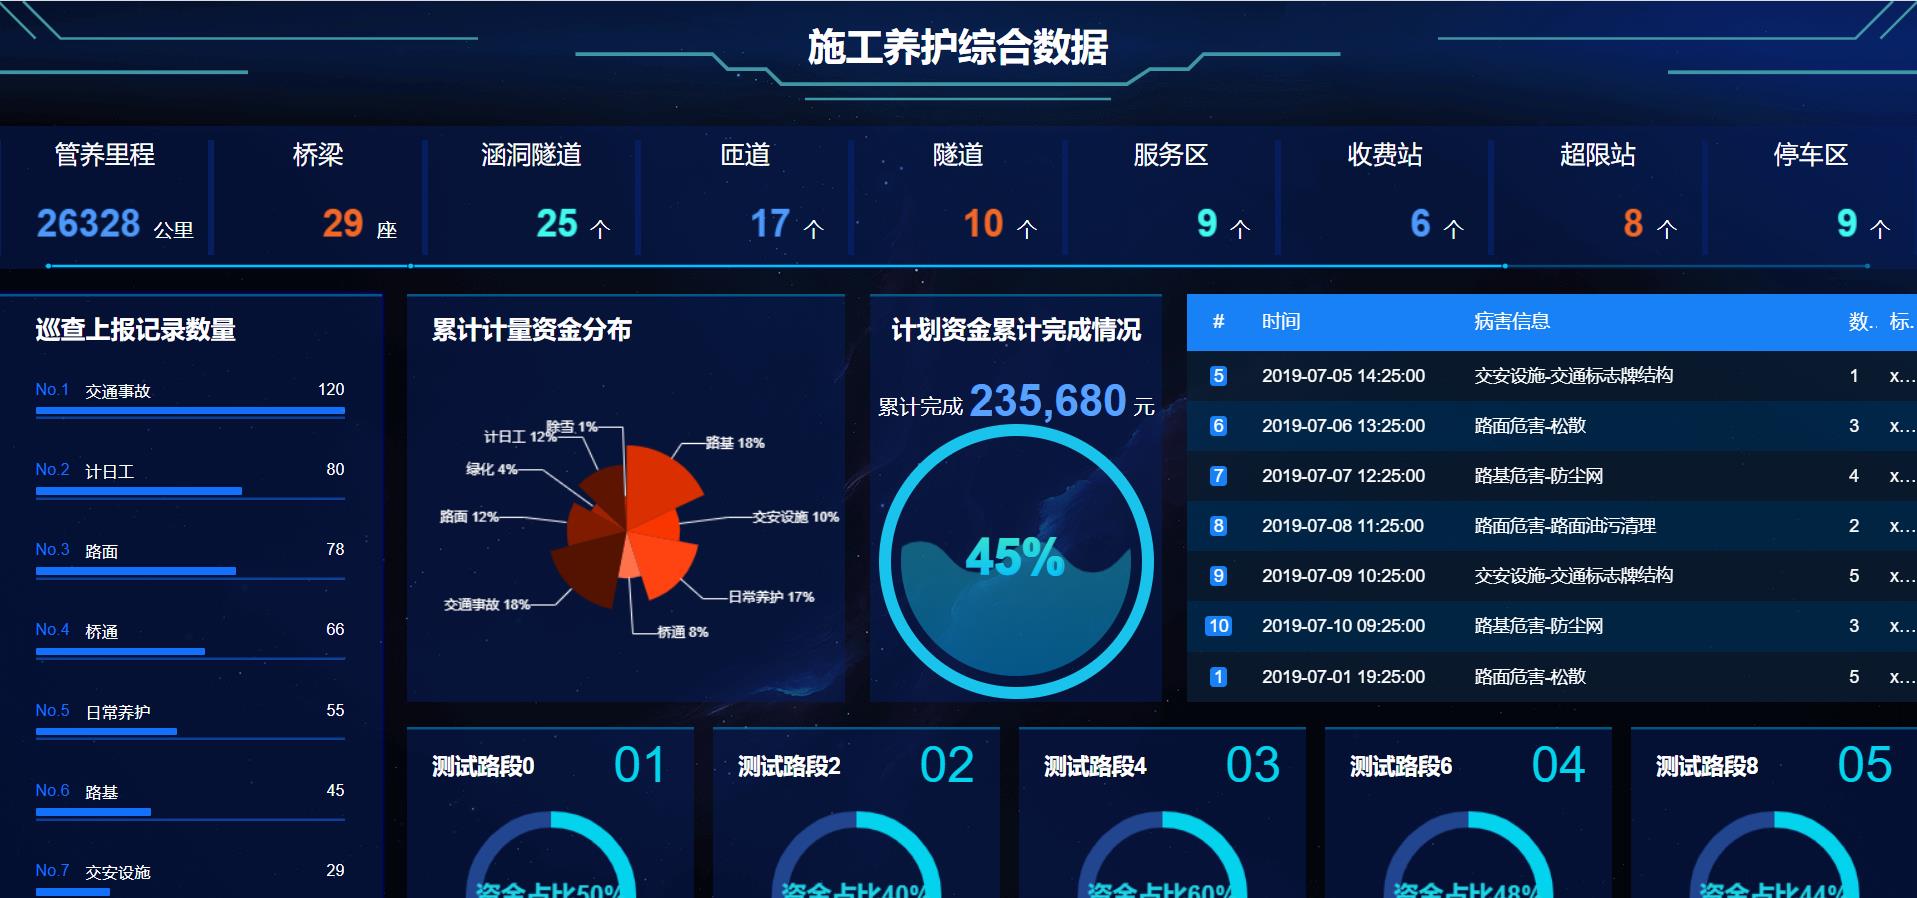
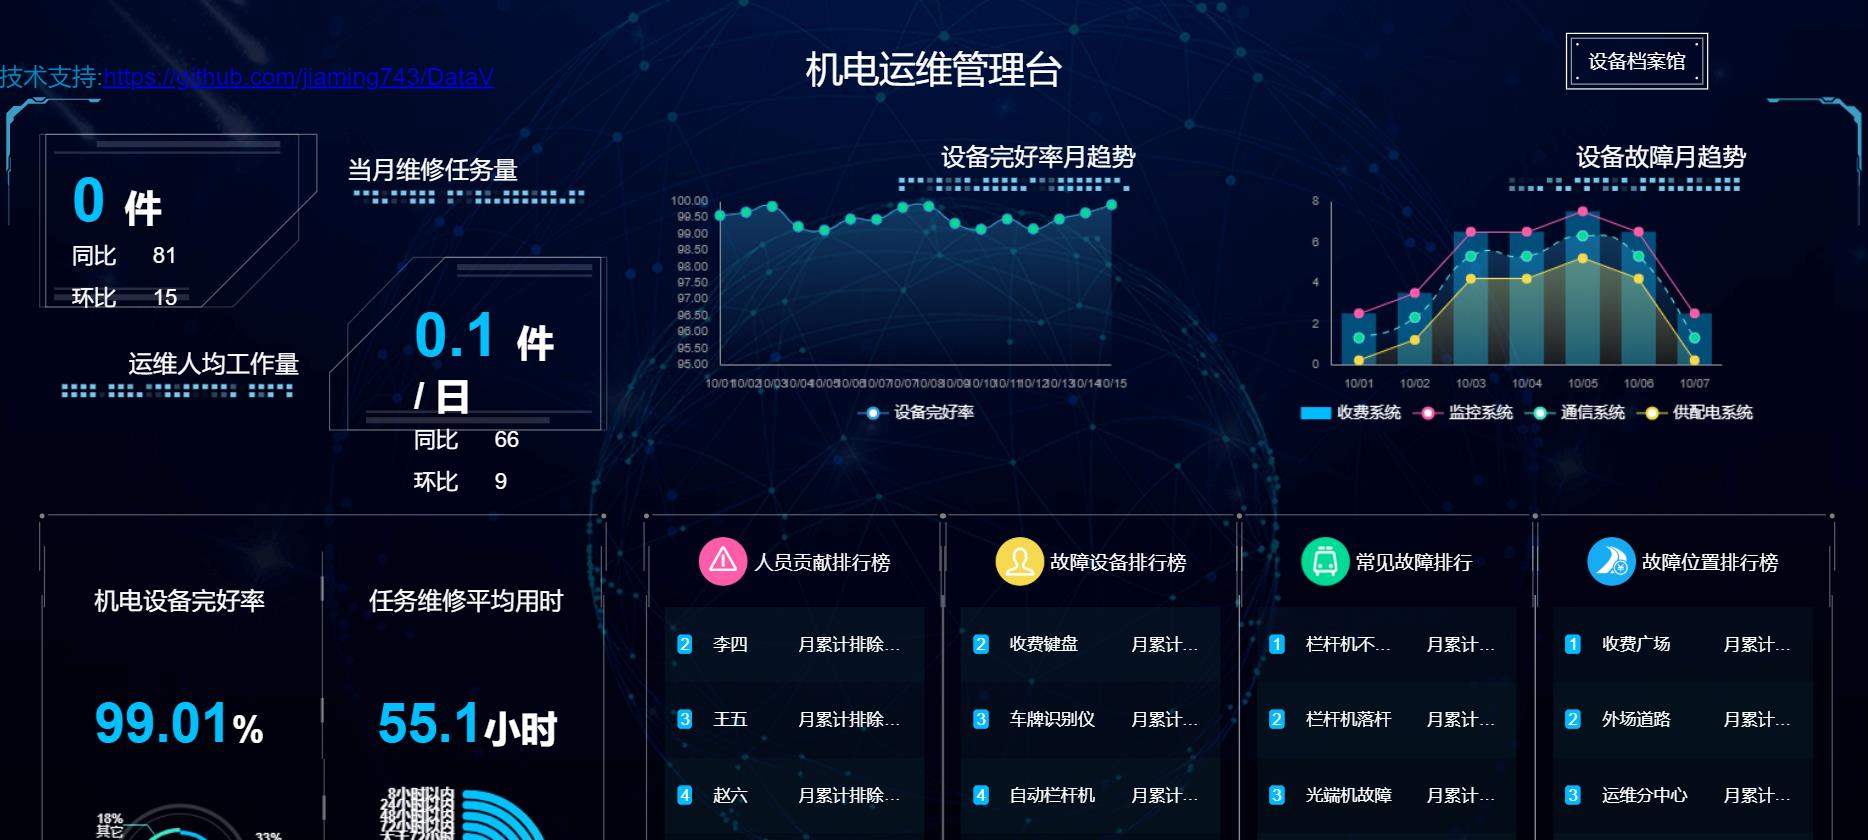
4.官方Demo
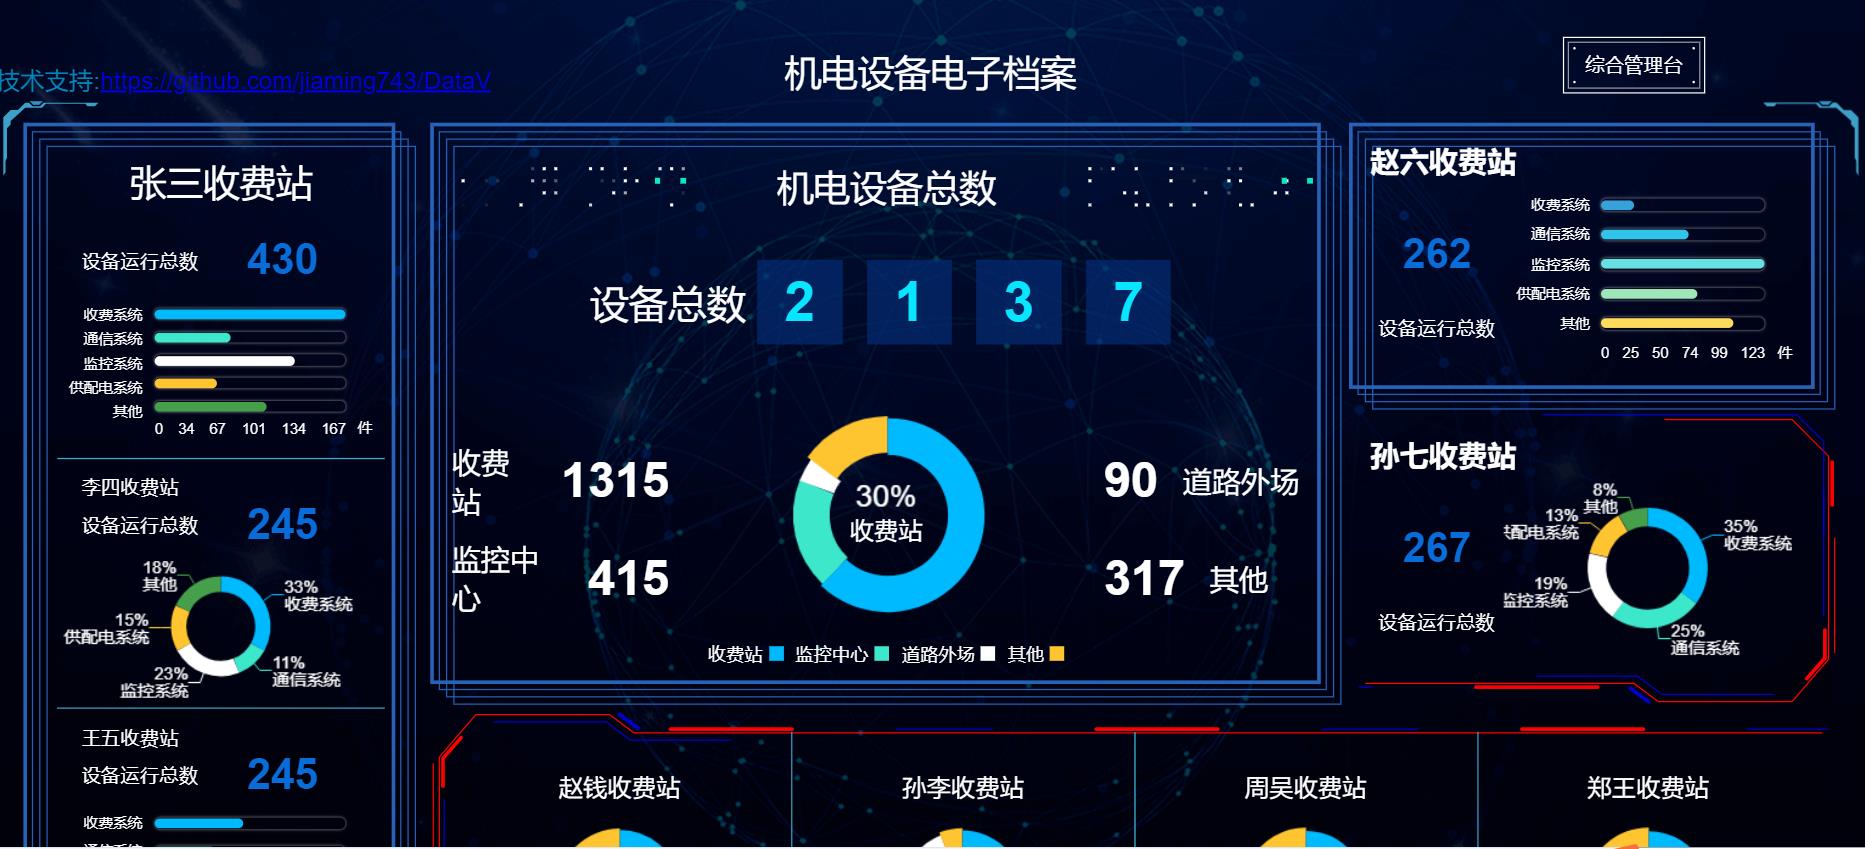 5.代码
5.代码
这里简单列举几个。
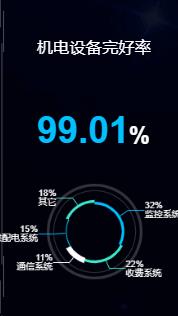
(1)图表的使用
<template>
  <div class="bottom-left-chart-1">
    <div class="header-name">机电设备完好率</div>
    <div class="details-value"><span>99.01</span>%</div>
    <dv-charts :option="option" />
  </div>
</template>

<script>
export default
  name: 'BottomLeftChart1',
  data ()
    return
      option:
        series: [

            type: 'pie',
            data: [
               name: '监控系统', value: 93, radius: ['30%', '33%'] ,
               name: '收费系统', value: 65, radius: ['32%', '35%'] ,
               name: '通信系统', value: 32, radius: ['31%', '37%'] ,
               name: '供配电系统', value: 44, radius: ['31%', '32%'] ,
               name: '其它', value: 52, radius: ['32%', '35%']
            ],
            outsideLabel:  // 饼状图外部标签配置
              labelLineEndLength: 20, // 标签线末端长度
              formatter: 'percent%\\nname',
              style:
                fill: '#fff'


          ,

            name: 'decoration ring',
            type: 'pie',
            data: [
               value: 10, radius: ['50%', '53%']
            ],
            outsideLabel:  // 饼状图外部标签配置
              show: false
            ,
            pieStyle:
              fill: 'rgba(255, 255, 255, 0.2)'

          ,

            name: 'decoration ring',
            type: 'pie',
            data: [
               value: 10, radius: ['45%', '46%']
            ],
            outsideLabel:
              show: false
            ,
            pieStyle:
              fill: 'rgba(255, 255, 255, 0.2)'


        ],
        color: ['#00c0ff', '#3de7c9', '#fff', '#00c0ff', '#3de7c9', '#fff']


</script>

<style lang="less">
.bottom-left-chart-1
  position: relative;

  .header-name
    height: 150px;
    line-height: 150px;
    font-size: 20px;
    text-align: center;


  .details-value
    height: 40px;
    font-size: 30px;
    font-weight: bold;
    text-align: center;

    span
      color: #00c0ff;
      font-size: 45px;


  .dv-charts-container
    height: calc(~"100% - 190px");


  .decoration-ring
    position: absolute;
    width: 200px;
    height: 200px;
    border-radius: 50%;
    border: 5px solid fade(#fefefe, 30);
    top: 190px;
    left: 50%;
    transform: translateX(-50%);


</style>
实现效果
(2)边框的使用
<template>
  <div class="top-left-cmp">
    <div class="dc-left">
      <dv-border-box-5>
        <div class="main-value"><span>0</span>件</div>
        <div class="compare-value"><span>同比</span>81</div>
        <div class="compare-value"><span>环比</span>15</div>
      </dv-border-box-5>
      <div class="dc-text">
        运维人均工作量
        <dv-decoration-3 style="width:200px;height:20px;" />
      </div>
    </div>
    <div class="dc-right">
      <div class="dc-text">
        当月维修任务量
        <dv-decoration-3 style="width:200px;height:20px;" />
      </div>
      <dv-border-box-5 :reverse="true">
        <div class="main-value"><span>0.1</span>件 / 日</div>
        <div class="compare-value"><span>同比</span>66</div>
        <div class="compare-value"><span>环比</span>9</div>
      </dv-border-box-5>
    </div>
  </div>
</template>

<script>
export default
  name: 'TopLeftCmp'

</script>

<style lang="less">
.top-left-cmp
  display: flex;

  .dc-left, .dc-right
    width: 50%;


  .dv-border-box-5
    height: 60%;


  .dc-text
    display: flex;
    flex-direction: column;
    height: 40%;
    font-size: 20px;
    padding: 20px;
    box-sizing: border-box;


  .dc-left .dc-text
    align-items: flex-end;
    justify-content: center;


  .dc-right .dc-text
    justify-content: flex-start;
    padding-top: 20px;


  .dc-left .dv-border-box-5
    padding: 30px;
    box-sizing: border-box;


  .dc-right .dv-border-box-5
    padding: 40px;
    padding-left: 75px;
    box-sizing: border-box;


  .main-value
    font-weight: bold;
    font-size: 22px;

    span
      font-size: 30px;
      color: #00c0ff;
      margin-right: 15px;


  .compare-value
    height: 35px;
    line-height: 35px;
    font-size: 18px;

    span
      margin-right: 30px;


</style>
实现效果

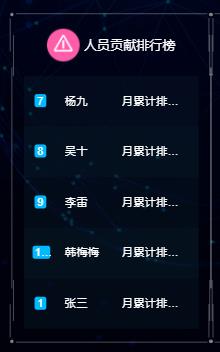
(3)轮播表
<template>
  <div class="bottom-right-table-1">
    <dv-border-box-6>
      <div class="table-name">
        <img src="./img/icon1.png" />人员贡献排行榜
      </div>

      <dv-scroll-board :config="config" />
    </dv-border-box-6>
  </div>
</template>

<script>
export default
  name: 'BottomRightTable1',
  data ()
    return
      config:
        data: [
          ['张三', '月累计排除故障:4起'],
          ['李四', '月累计排除故障:3起'],
          ['王五', '月累计排除故障:3起'],
          ['赵六', '月累计排除故障:3起'],
          ['钱七', '月累计排除故障:2起'],
          ['孙八', '月累计排除故障:2起'],
          ['杨九', '月累计排除故障:2起'],
          ['吴十', '月累计排除故障:2起'],
          ['李雷', '月累计排除故障:2起'],
          ['韩梅梅', '月累计排除故障:2起']
        ],
        index: true,
        columnWidth: [40, 70], //列宽度
        align: ['center'],
        oddRowBGC: 'rgba(9, 37, 50, 0.4)', //奇数行背景色
        evenRowBGC: 'rgba(10, 32, 50, 0.3)' //偶数行背景色


</script>

<style lang="less">
.bottom-right-table-1
  width: calc(~"25% + 10px");
  height: 100%;
  margin: 0 -5px;

  .border-box-content
    padding: 20px;
    box-sizing: border-box;


  .table-name
    height: 45px;
    display: flex;
    justify-content: center;
    align-items: center;
    margin-bottom: 15px;

    img
      width: 40px;
      height: 40px;
      margin-right: 5px;


  .dv-scroll-board
    height: calc(~"100% - 60px");


</style>
实现效果
以上是关于DataV构建大屏(全屏)数据展示页面的主要内容,如果未能解决你的问题,请参考以下文章
海量大数据大屏分析展示一步到位:DataWorks数据服务对接DataV最佳实践