在vue中使用echarts
Posted 野猪佩奇007
tags:
篇首语:本文由小常识网(cha138.com)小编为大家整理,主要介绍了在vue中使用echarts相关的知识,希望对你有一定的参考价值。
项目场景:
在Vue中使用echarts制作图表
安装echarts依赖:
npm install echarts -S
创建图表:
全局引入:
在main.js中
// 引入echarts
import echarts from 'echarts'
Vue.prototype.$echarts = echarts
//有的会引入报错或没效果
//建议更换
import * as echarts from 'echarts'
Vue.prototype.$echarts = echarts
使用:
在Echarts.vue中
<div id="echart-line" :style="width: '400px', height: '500px'"></div>

export default
  name: "HelloWorld",
  props:
    msg: String,
  ,
  mounted()
    this.initChart();
  ,
  methods:
    initChart()
        // 基于准备好的dom,初始化echarts实例
        let myChart = this.$echarts.init(document.getElementById('echart-line'))
        // 绘制图表
        myChart.setOption(
            title:  text: 'echarts' ,
            tooltip: ,
            //全局取色盘
            color: ["#00f", "#f00", "#0f0"],
            xAxis:
                data: ["拖鞋","跑步鞋","运动鞋","长筒靴","老爹鞋","板鞋"]
            ,
            yAxis: ,
            series: [
                name: '销量',
                type: 'bar',
                data: [20, 18, 36, 10, 10, 20]
            ]
        );

  ,
;
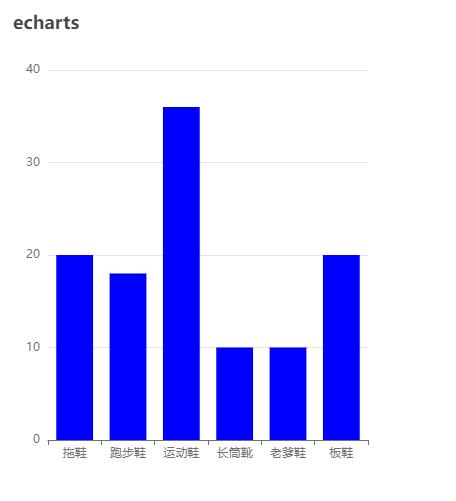
效果:

一个简单的图表就完成了,后续就需要自己在echarts官网自己找对应的图标,更换内容代码即可
echarts官网:https://echarts.apache.org/zh/index.html
以上是关于在vue中使用echarts的主要内容,如果未能解决你的问题,请参考以下文章