利用Axes3D绘制三维性能曲面
Posted 卓晴
tags:
篇首语:本文由小常识网(cha138.com)小编为大家整理,主要介绍了利用Axes3D绘制三维性能曲面相关的知识,希望对你有一定的参考价值。
简 介: 绘制二维函数的3D曲面图可以帮助我们更好理解函数内所蕴含的规律。Axes3D是matplotlib中的绘制函数。利用surface, countour,countourf等可以很好的显示函数3D内容。
关键词: Axes3D,surface,contour,II
§01 绘制曲面
很多时候需要绘制三维曲面,比如绘制二维函数取值,优化问题在二维上的切片投影等。通过 绘制分类界面以及性能曲面中的meshgrid函数 或者二维的格点,经过计算可以通过surface, contour等函数绘制三维曲面和等高线。
一、绘制举例
1、测试代码
from headm import *                 #

from mpl_toolkits.mplot3d import Axes3D

x = arange(-4, 4, 0.1)
y = arange(-4, 4, 0.1)
x,y = meshgrid(x, y)
r = sqrt(x**2+y**2)
z = sin(r)

printt(z.shape\\)

ax = Axes3D(plt.figure(figsize=(12,8)))
ax.plot_surface(x,y,z,rstride=1, cstride=2, cmap=plt.cm.hot)
ax.contour(x,y,z,
           zdir='z',
           offset=-2,
           cmap=plt.cm.hot)

ax.set_zlim(-2,2)
plt.show()
2、测试结果
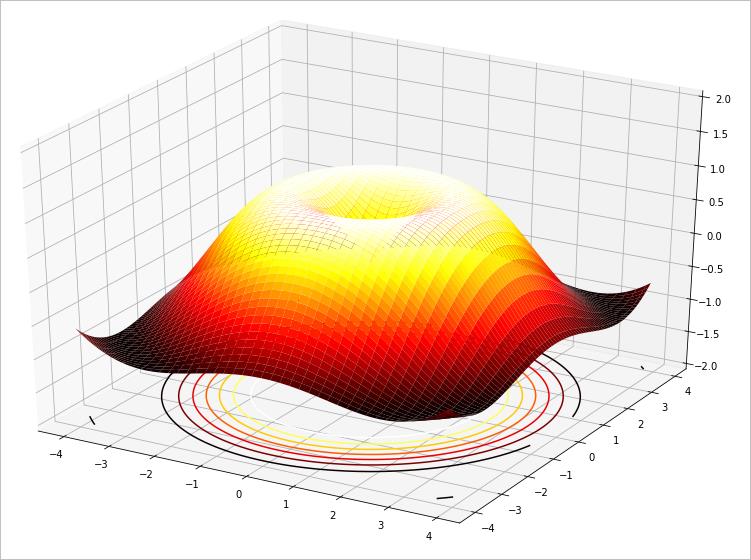
▲ 图1.1.1 绘制出的z三维函数
z.shape:(80, 80)
二、颜色参数
在 Python可视化|matplotlib07-自带颜色条Colormap(三) 给出了 cmap的各种组合。
1、颜色名称
['Accent', 'Blues', 'BrBG', 'BuGn', 'BuPu', 'CMRmap', 'Dark2', 'GnBu', 'Greens', 'Greys', 'OrRd', 'Oranges', 'PRGn', 'Paired', 'Pastel1', 'Pastel2', 'PiYG', 'PuBu', 'PuBuGn', 'PuOr', 'PuRd', 'Purples', 'RdBu', 'RdGy', 'RdPu', 'RdYlBu', 'RdYlGn', 'Reds', 'Set1', 'Set2', 'Set3', 'Spectral', 'Wistia', 'YlGn', 'YlGnBu', 'YlOrBr', 'YlOrRd', 'afmhot', 'autumn', 'binary', 'bone', 'brg', 'bwr', 'cividis', 'cool', 'coolwarm', 'copper', 'cubehelix', 'flag', 'gist_earth', 'gist_gray', 'gist_heat', 'gist_ncar', 'gist_stern', 'gist_yarg', 'gnuplot', 'gnuplot2', 'gray', 'hot', 'hsv', 'inferno', 'jet', 'magma', 'nipy_spectral', 'ocean', 'pink', 'plasma', 'prism', 'rainbow', 'seismic', 'spring', 'summer', 'tab10', 'tab20', 'tab20b', 'tab20c', 'terrain', 'twilight', 'twilight_shifted', 'viridis', 'winter']
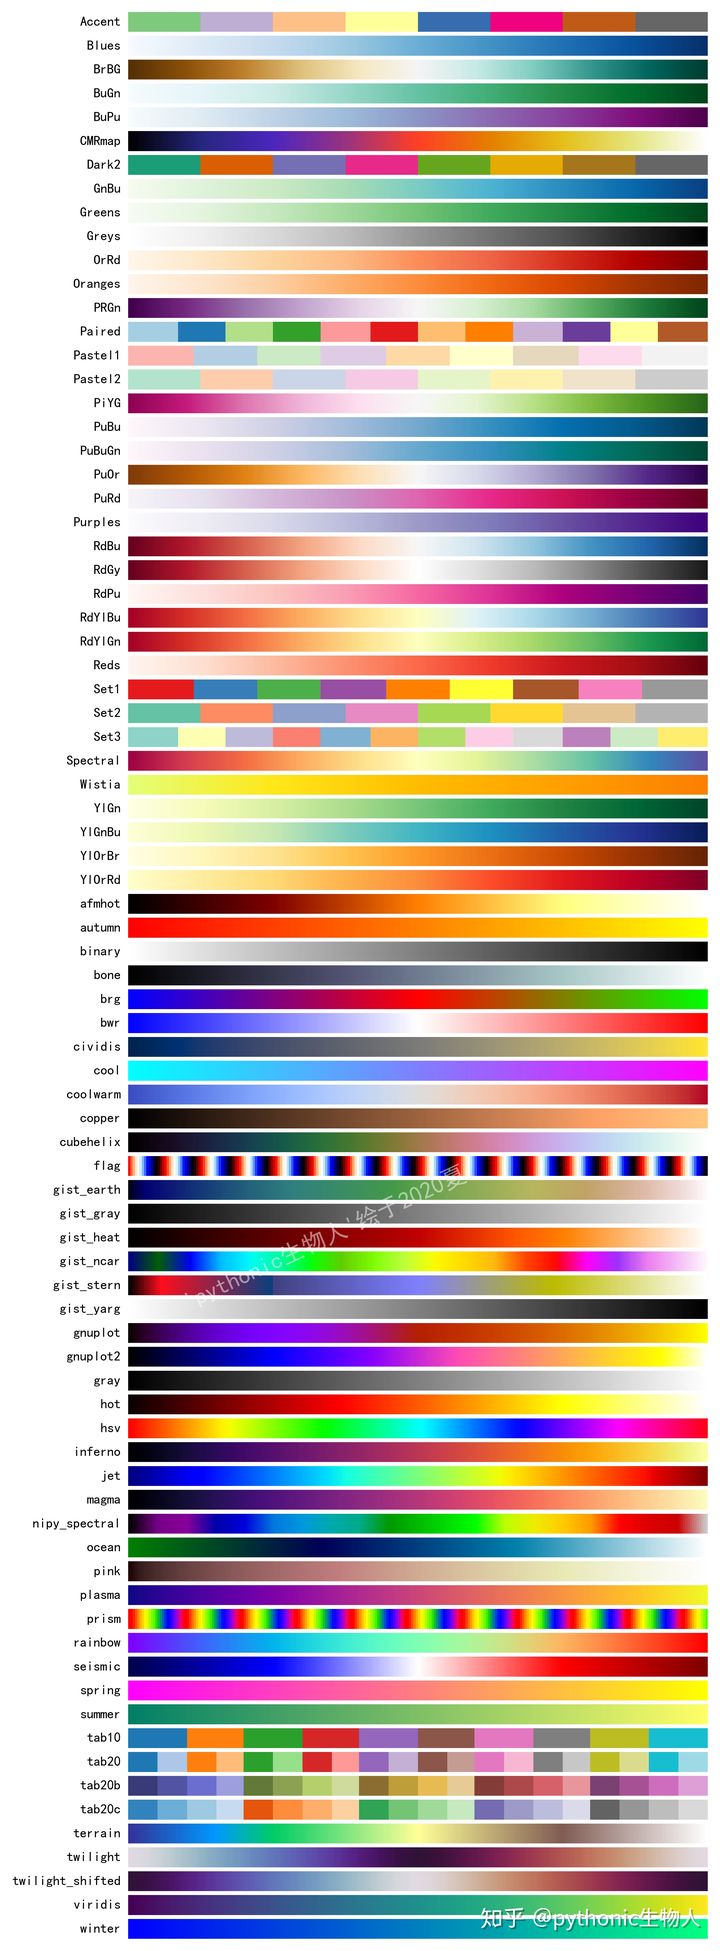
▲ 图1.2.1 colormap中的颜色
2、改变颜色
ax.plot_surface(x,y,z,rstride=1, cstride=2, cmap=plt.cm.Blues)
ax.contourf(x,y,z,
           zdir='z',
           offset=-2,
           cmap=plt.cm.BuGn)
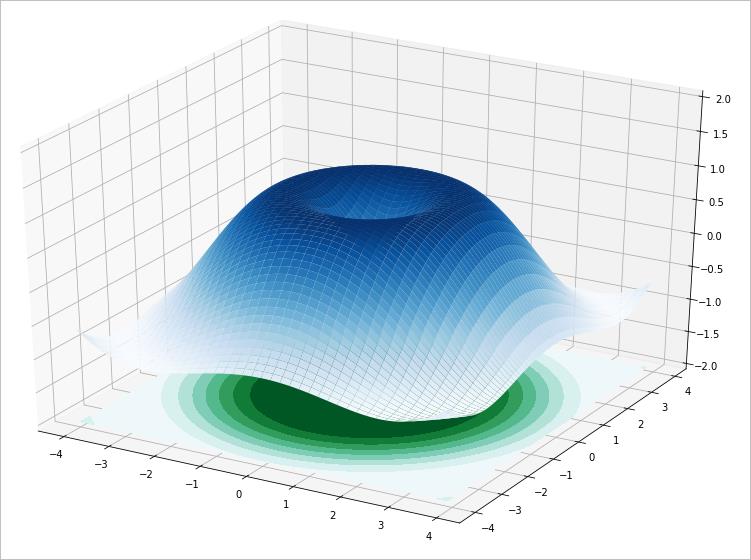
▲ 图1.2.2 改变颜色后的高度图
§02 更多举例
一、电阻组合
在 通过一个端口读取多个按钮 搜索了多个电阻并联开关的时候,对应的最大电压间隔。可以看到其中峰值非常复杂。下面对于两个电阻组合进行搜索,绘制性能曲面。
1、搜索代码
R0                     = 1e3
U0                     = 3.3
def minVoltage(r1,r2):
    rdim = [10e10, r1, r2,
            1/(1/r1 + 1/r2)]
    vdim = sorted([r/(r+R0)*U0 for r in rdim])
    vdiff = [b-a for a,b in zip(vdim[:-1], vdim[1:])]
    vdiff.append(vdim[0])

    return min(vdiff)

STEP_NUM        = 50
x = arange(100, 10000, STEP_NUM)
y = arange(100, 10000, STEP_NUM)
x,y = meshgrid(x, y)

z = array([minVoltage(x,y) for x,y in zip(x.flatten(), y.flatten())]).reshape(x.shape)
2、搜索结果
(1)搜索范围:100:10000:50
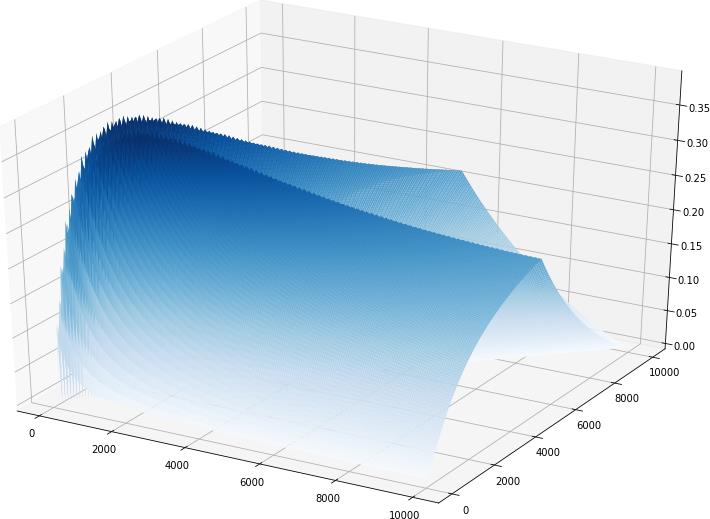
▲ 图2.1.1 搜索R1,R2的性能曲线
(2)搜索范围:500:3000:10
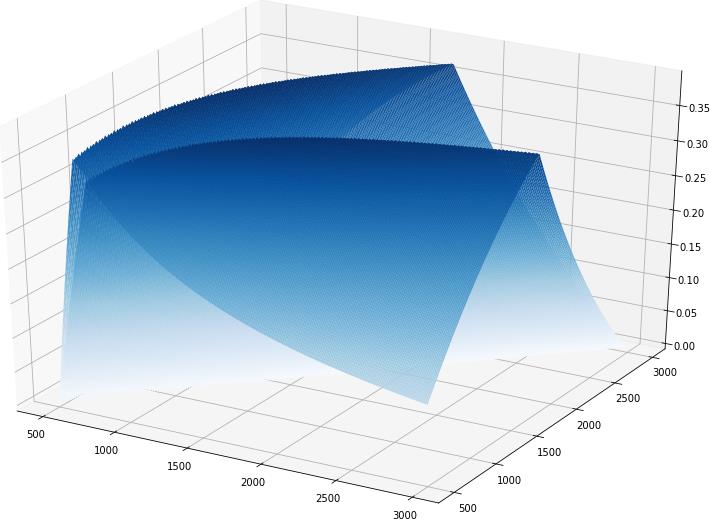
▲ 图2.1.2 搜索R1,R2性能曲线
(3)搜索范围:500:4000:10
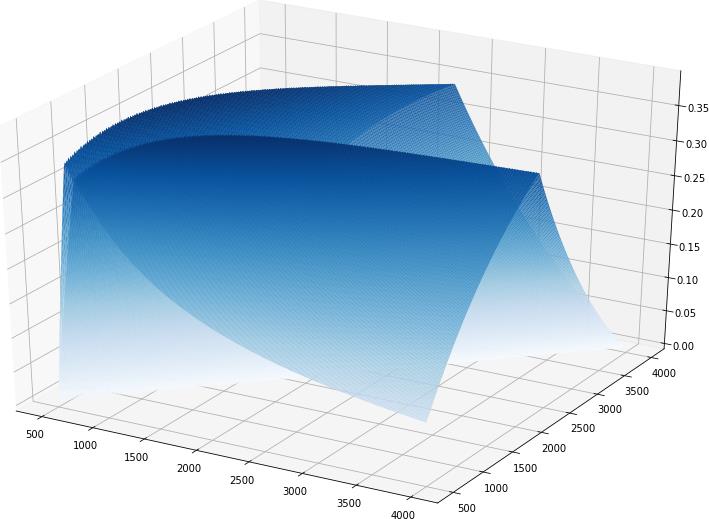
▲ 图2.1.3 搜索R1,R2性能曲线
3、切片到一维
R1 = 4e3
R2 = linspace(0, 10000, 10000)
z = [minVoltage(R1, r2) for r2 in R2]
plt.clf()
plt.figure(figsize=(12,8))
plt.plot(R2, z)
plt.xlabel("R2")
plt.ylabel("Z")
plt.grid(True)
plt.tight_layout()
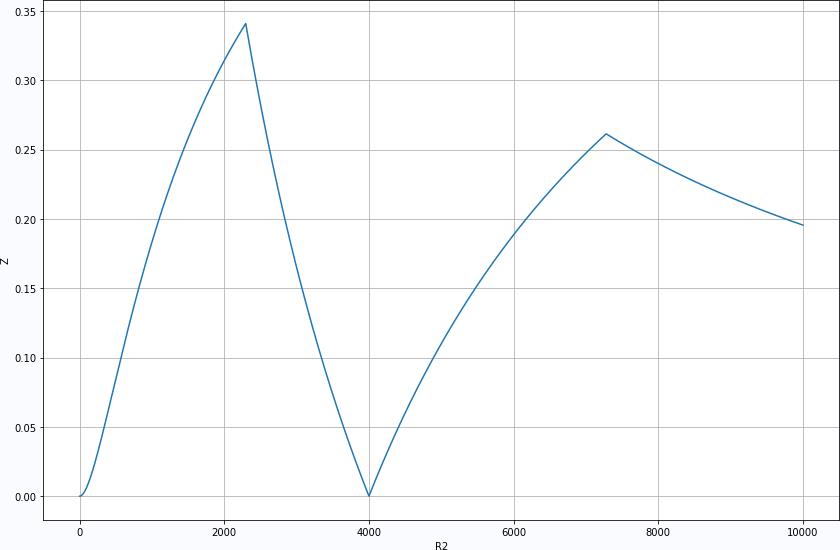
▲ 图2.1.4 R2对应的最大电压
二、二维非线性函数
f
=
10
4
x
1
2
−
2.1
x
1
4
+
1
3
x
1
6
+
x
1
x
2
−
4
x
2
2
+
4
x
2
2
+
2
f = 10 \\over 4x_1^2 - 2.1x_1^4 + 1 \\over 3x_1^6 + x_1 x_2 - 4x_2^2 + 4x_2^2 + 2
f=4x12−2.1x14+31 以上是关于利用Axes3D绘制三维性能曲面的主要内容,如果未能解决你的问题,请参考以下文章 matlab三维阴影曲面绘图函数surfsurfcfurflmatlab图行绘制六