iOS AAChartKit 图表库的使用
Posted 长沙火山
tags:
篇首语:本文由小常识网(cha138.com)小编为大家整理,主要介绍了iOS AAChartKit 图表库的使用相关的知识,希望对你有一定的参考价值。
一、介绍
AAChartKit 项目,是AAInfographics的 Objective-C 语言版本,是在流行的开源前端图表库Highcharts的基础上,封装的面向对象的,一组简单易用,极其精美的图表绘制控件。
- 环境友好,兼容性强. 适配 ios 8+, 支持iOS、 iPad OS、macOS, 支持 Objective-C语言, 同时更有 Swift 语言版本 AAInfographics 、 Java 语言版本 AAChartCore 、Kotlin 语言版本 AAChartCore-Kotlin 可供使用, 配置导入工程简单易操作。
- 功能强大,类型多样 。支持柱状图 、条形图 、折线图 、曲线图 、折线填充图 、曲线填充图、雷达图、极地图、扇形图、气泡图、散点图、区域范围图、柱形范围图、面积范围图、面积范围均线图、直方折线图、直方折线填充图、箱线图、瀑布图、热力图、桑基图、金字塔图、漏斗图、等二十几种类型的图形,不可谓之不多。
GitHub地址:https://github.com/AAChartModel/AAChartKit/blob/master
二、基础用法
根据官方文档的介绍,实现一个最简单的图表,代码如下:
#import "ColumnChartController.h"
#import "AAChartKit.h"
@interface ColumnChartController ()<AAChartViewEventDelegate>
@end
@implementation ColumnChartController
- (void)viewDidLoad
[super viewDidLoad];
self.title = @"Column Chart 柱状图";
// 1.创建视图AAChartView
CGFloat chartViewWidth = self.view.frame.size.width;
CGFloat chartViewHeight = self.view.frame.size.height - 250;
AAChartView *chartView = [[AAChartView alloc]init];
chartView.delegate = self;
chartView.frame = CGRectMake(0, 60, chartViewWidth, chartViewHeight);
禁用 AAChartView 滚动效果(默认不禁用)
//self.aaChartView.scrollEnabled = NO;
[self.view addSubview:chartView];
// 2.配置视图模型AAChartModel
AAChartModel *aaChartModel = AAChartModel.new
.chartTypeSet(AAChartTypeArea)//设置图表的类型(这里以设置的为折线面积图为例)
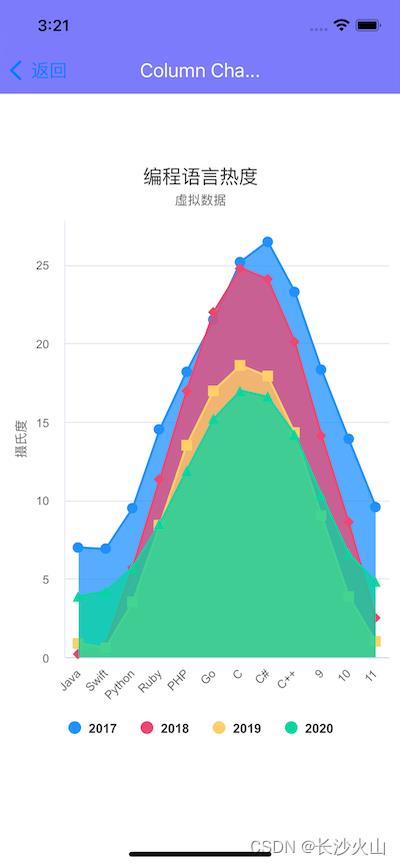
.titleSet(@"编程语言热度")//设置图表标题
.subtitleSet(@"虚拟数据")//设置图表副标题
.categoriesSet(@[@"Java",@"Swift",@"Python",@"Ruby", @"php",@"Go",@"C",@"C#",@"C++"])//图表横轴的内容
.yAxisTitleSet(@"摄氏度")//设置图表 y 轴的单位
.seriesSet(@[
AASeriesElement.new
.nameSet(@"2017")
.dataSet(@[@7.0, @6.9, @9.5, @14.5, @18.2, @21.5, @25.2, @26.5, @23.3, @18.3, @13.9, @9.6]),
AASeriesElement.new
.nameSet(@"2018")
.dataSet(@[@0.2, @0.8, @5.7, @11.3, @17.0, @22.0, @24.8, @24.1, @20.1, @14.1, @8.6, @2.5]),
AASeriesElement.new
.nameSet(@"2019")
.dataSet(@[@0.9, @0.6, @3.5, @8.4, @13.5, @17.0, @18.6, @17.9, @14.3, @9.0, @3.9, @1.0]),
AASeriesElement.new
.nameSet(@"2020")
.dataSet(@[@3.9, @4.2, @5.7, @8.5, @11.9, @15.2, @17.0, @16.6, @14.2, @10.3, @6.6, @4.8]),
]);
// 3.图表视图对象调用图表模型对象,绘制最终图形
[chartView aa_drawChartWithChartModel:aaChartModel];
// /*仅仅更新 AAChartModel 对象的 series 属性时,动态刷新图表*/
// [chartView aa_onlyRefreshTheChartDataWithChartModelSeries:aaChartModelSeriesArray];
//
// /*更新 AAChartModel 内容之后,刷新图表*/
// [chartView aa_refreshChartWithChartModel:aaChartModel];
//实现对 AAChartView 事件代理的监听
#pragma mark -- AAChartView delegate
- (void)aaChartView:(AAChartView *)aaChartView moveOverEventWithMessage:(AAMoveOverEventMessageModel *)message
NSLog(@"🚀selected point series element name: %@",message.name);
@end
效果图:
三、自定义用法
根据项目自己的需求,实现一个最简单的图表,代码如下:
#import "ColumnMonthController.h"
#import "AAChartKit.h"
@interface ColumnMonthController ()<AAChartViewEventDelegate>
@property (nonatomic, strong) AAChartModel *aaChartModel;
@property (nonatomic, strong) AAChartView *aaChartView;
@property (nonatomic, strong) UILabel *tipLab;
@end
@implementation ColumnMonthController
- (void)viewDidLoad
[super viewDidLoad];
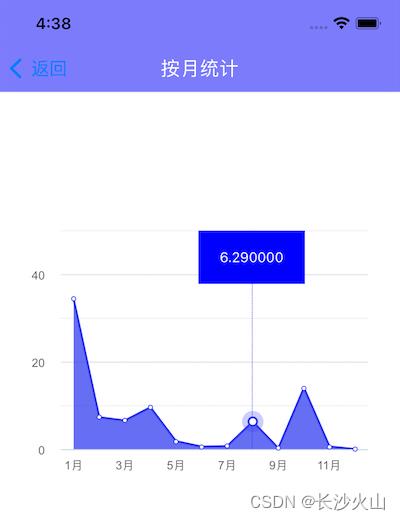
self.title = @"按月统计";
[self initAAChartView];
[self initData];
self.tipLab = [[UILabel alloc] initWithFrame:CGRectMake(0, 130, 100, 50)];
self.tipLab.backgroundColor = [UIColor blueColor];
self.tipLab.textColor = [UIColor whiteColor];
self.tipLab.font = [UIFont systemFontOfSize:13];
self.tipLab.textAlignment = NSTextAlignmentCenter;
self.tipLab.hidden = YES;
[self.view addSubview:self.tipLab];
- (void)initAAChartView
_aaChartView = [[AAChartView alloc] initWithFrame:CGRectMake(20, 120, SCREEN_WIDTH-40, 250)];
_aaChartView.delegate = self;
_aaChartView.scrollEnabled = NO;//禁用 AAChartView 滚动效果
[self.view addSubview:_aaChartView];
//设置 AAChartView 的背景色是否为透明
_aaChartView.isClearBackgroundColor = YES;
- (void)initData
NSArray *timeData = @[@"1月",@"2月",@"3月",@"4月",@"5月",@"6月",@"7月",@"8月",@"9月",@"10月",@"11月",@"12月"];
NSArray *listData = @[@34.29,@7.29,@6.54,@9.56,@1.82,@0.57,@0.68,@6.29,@0.2,@14,@0.59,@0]; //此数组里面只能存放NSNumber类型,不能放字符串,否则不会显示内容
_aaChartModel = AAChartModel.new
.chartTypeSet(AAChartTypeArea)//图表类型
.titleSet(@"")//图表主标题
.subtitleSet(@"")//图表副标题
.colorsThemeSet(@[@"#333df0"])//设置主题颜色数组
.markerSymbolStyleSet(AAChartSymbolStyleTypeInnerBlank)//折线连接点样式为内部白色
.yAxisLineWidthSet(@0)//Y轴轴线线宽为0即是隐藏Y轴轴线
.yAxisLabelsEnabledSet(true) //Y 轴是否显示文字
.yAxisMaxSet(@50)//设置Y轴最大值
.yAxisTitleSet(@"") //Y 轴标题
.xAxisTickIntervalSet(@2) //X 轴刻度点间隔数(设置每隔几个点显示一个 X轴的内容)
.xAxisCrosshairSet([AACrosshair crosshairWithColor:@"#333df0" dashStyle:AAChartLineDashStyleTypeShortDash width:@0.5])
.legendEnabledSet(false)
.categoriesSet(timeData)
.tooltipEnabledSet(false)
.markerRadiusSet(@2)
.seriesSet(@[
AASeriesElement.new
.nameSet(@"")
.lineWidthSet(@1)
.dataSet(listData)
]);
NSMutableArray *arr = [NSMutableArray array];
for (NSInteger i = 1; i <= 5; i ++)
AAPlotLinesElement *element = [AAPlotLinesElement new];
element.dashStyleSet(AAChartLineDashStyleTypeShortDash)//样式:Dash,Dot,Solid等,默认Solid
.widthSet(@(0.5)) //标示线粗细
.valueSet(@(i*10)) //所在位置
.zIndexSet(@(1))//层叠,标示线在图表中显示的层叠级别,值越大,显示越向前
.colorSet(@"#DCDCDC")
.labelSet(AALabel.new);
[arr addObject:element];
_aaChartModel
.yAxisMinSet(@(0))//Y轴最小值
.yAxisAllowDecimalsSet(NO)//是否允许Y轴坐标值小数
.yAxisPlotLinesSet(arr.copy);
[_aaChartView aa_drawChartWithChartModel:_aaChartModel];
//实现对 AAChartView 事件代理的监听
#pragma mark -- AAChartView delegate
- (void)aaChartView:(AAChartView *)aaChartView moveOverEventWithMessage:(AAMoveOverEventMessageModel *)message
NSDictionary *messageDic = @
@"category":message.category,
@"index":@(message.index),
@"name":message.name,
@"offset":message.offset,
@"x":message.x,
@"y":message.y
;
NSNumber *plotX = message.offset[@"plotX"];
self.tipLab.hidden = NO;
self.tipLab.text = [NSString stringWithFormat:@"%f",[message.y floatValue]];
self.tipLab.centerX = [plotX floatValue]+6+50;
NSLog(@"mes:%@", messageDic);
@end
效果图:

以上是关于iOS AAChartKit 图表库的使用的主要内容,如果未能解决你的问题,请参考以下文章