Windows10+Faster-RCNN-TensorFlow-Python3-master+VOC2007数据集
Posted 大彤小忆
tags:
篇首语:本文由小常识网(cha138.com)小编为大家整理,主要介绍了Windows10+Faster-RCNN-TensorFlow-Python3-master+VOC2007数据集相关的知识,希望对你有一定的参考价值。
使用Faster R-CNN算法在VOC2007数据集上实现目标检测。
一、所需文件下载链接
- Faster R-CNN源码及操作步骤Github链接→Faster-RCNN-TensorFlow-Python3。
- Faster-RCNN-TensorFlow-Python3-master压缩包百度云盘链接→提取码:76wq。
- VOC2007数据集百度云盘链接→提取码:z8sd。
VOC2007数据集的解析→VOC2007数据集详细分析。
二、基础环境配置
- Windows10 + Anaconda3 + PyCharm 2019.3.3
- 安装CPU版本的TensorFlow
- 在PyCharm中配置好TensorFlow环境
三、训练及测试过程
-
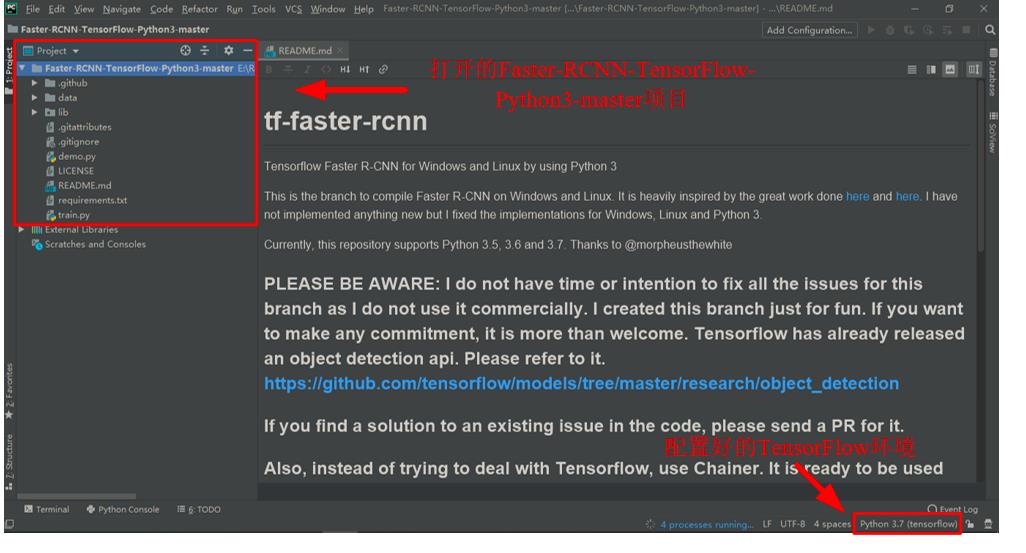
在配置好TensorFlow环境的PyCharm中打开下载并解压好的
Faster-RCNN-TensorFlow-Python3-master项目。
-
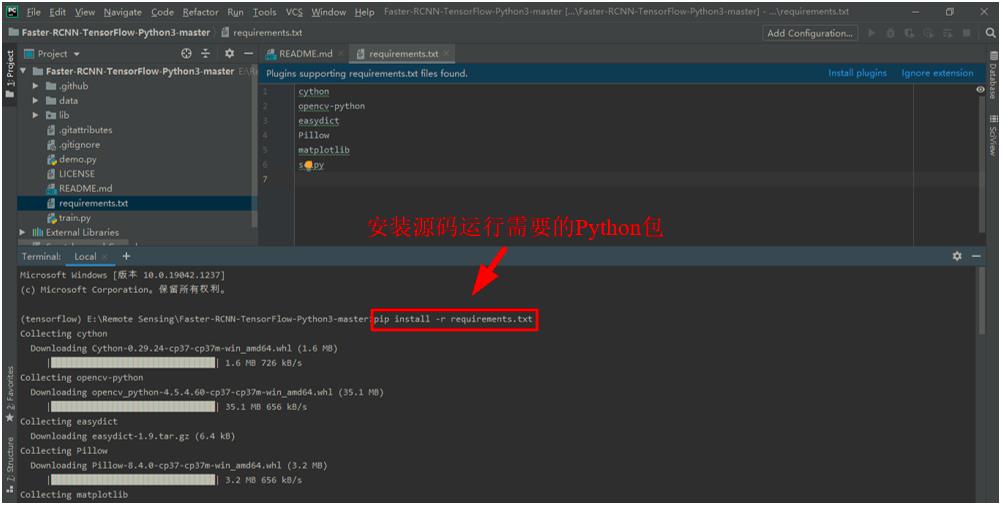
安装源码运行需要的Python包。打开好的Faster-RCNN-TensorFlow-Python3-master项目中有一个
requirement.txt文件,其中记录了需要安装的包的名字。在PyCharm的终端Terminal中输入pip install -r requirements.txt后回车,安装需要的所有依赖包。

-
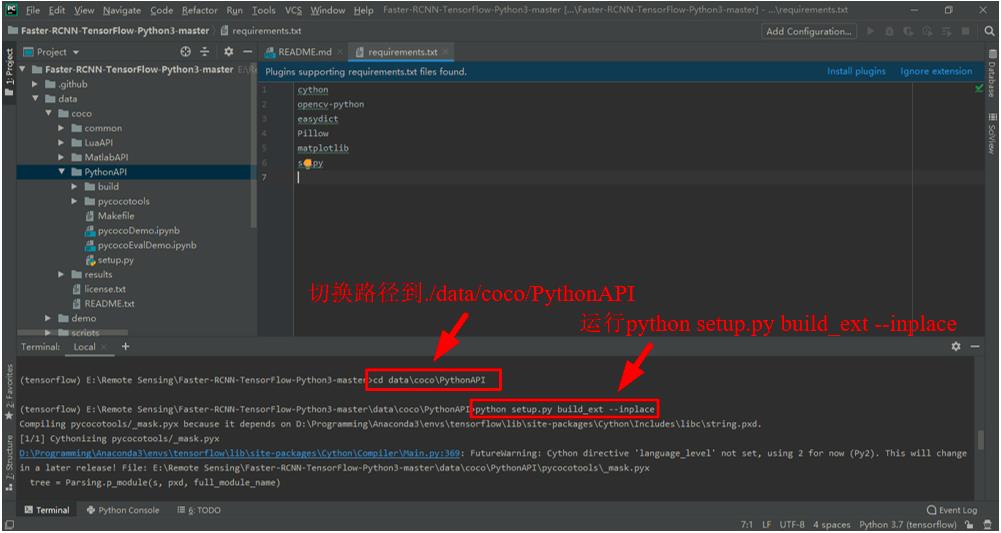
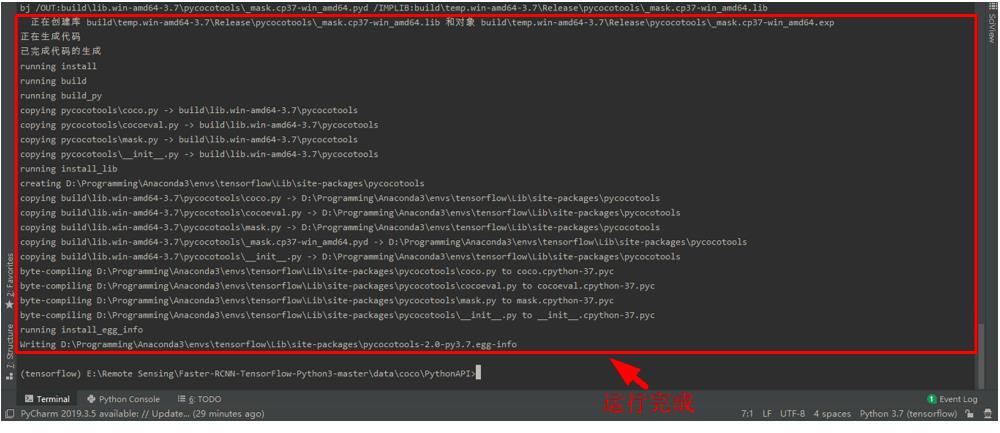
在PyCharm的终端Terminal中输入
cd data\\coco\\PythonAPI切换路径到./data/coco/PythonAPI,然后输入python setup.py build_ext --inplace并回车。

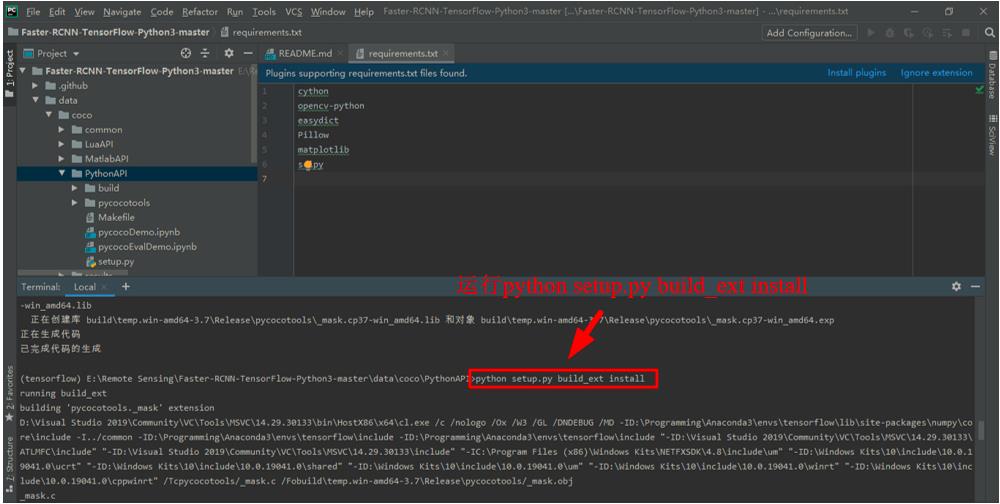
再输入python setup.py build_ext install并回车。
-
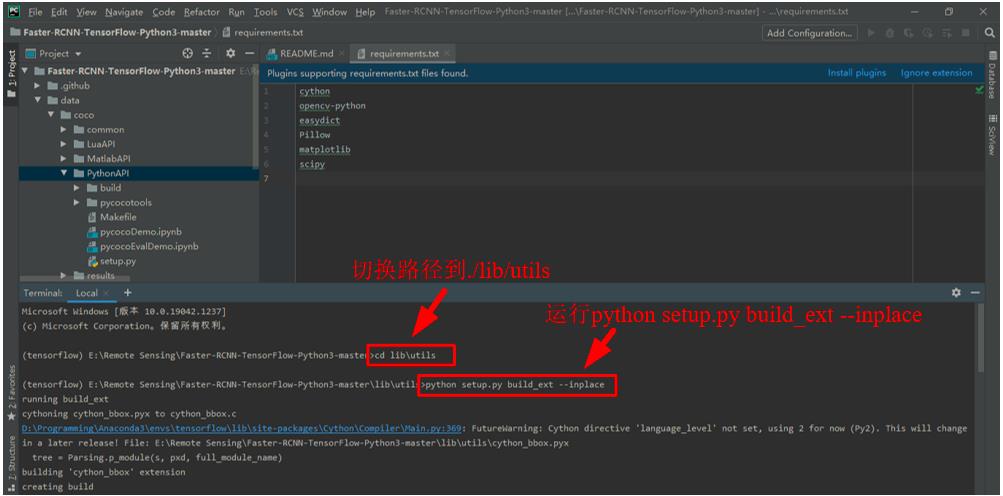
在PyCharm的终端Terminal中输入
exit退出当前路径,然后输入cd lib\\utils切换路径到./lib/utils,再输入python setup.py build_ext --inplace并回车。

-
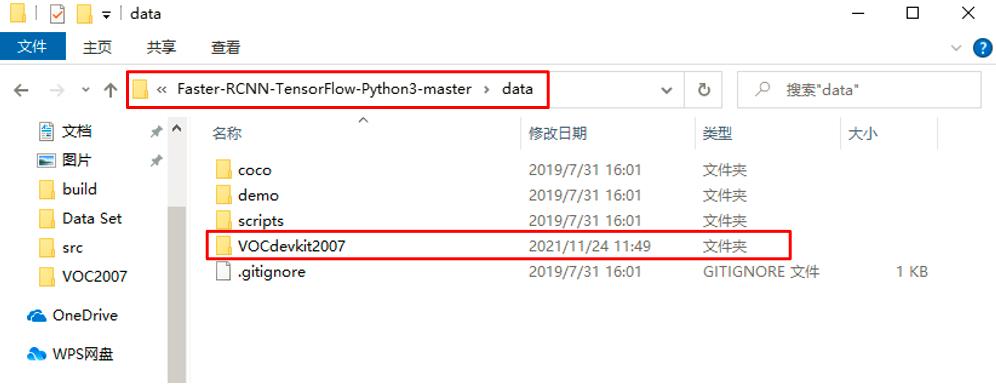
将解压好的VOC2007数据集文件夹
VOCDevkit重命名为VOCDevkit2007,并复制到./data文件夹下。
-
下载预训练模型VGG16,在
./data文件夹下新建文件夹imagenet_weights,将下载好的vgg_16_2016_08_28.tar.gz解压到./data/imagenet_weights路径下,并将vgg_16.ckpt重命名为vgg16.ckpt。

-
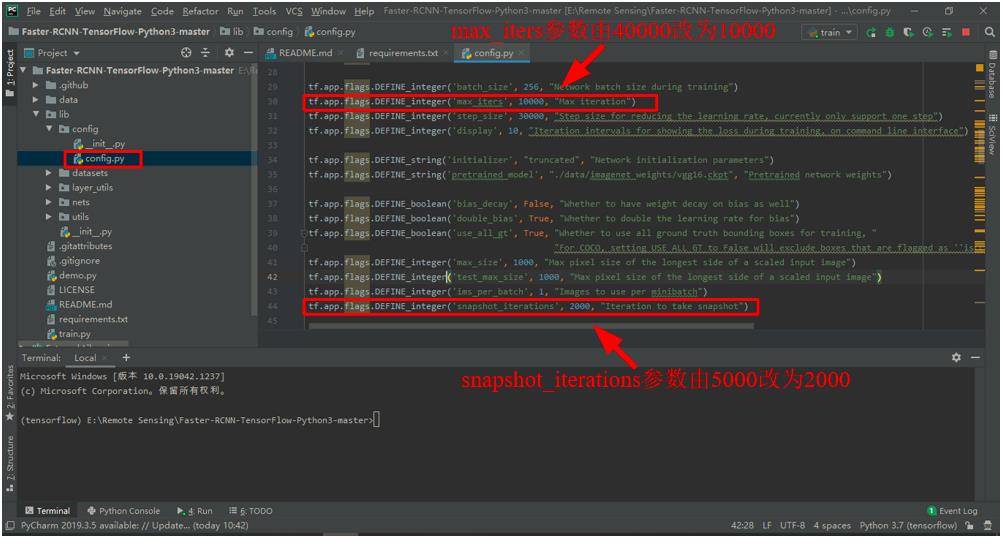
修改
config.py文件。在./lib/config文件夹下的config.py文件,是专门的配置文件,其中定义了模型的诸多参数,大家可以根据自己的需要修改相关参数。在这里,为了减少训练时间,我将最大迭代次数max_iters参数由40000改为10000,同时将迭代多少次保存一次模型snap_iterations参数由5000改为2000,其他参数未作改变。
-
在PyCharm中打开
train.py文件 ,如果后面想要可视化loss的话,需要在如下图所示的两处添加代码,如果不需要的话,可忽略这一步。
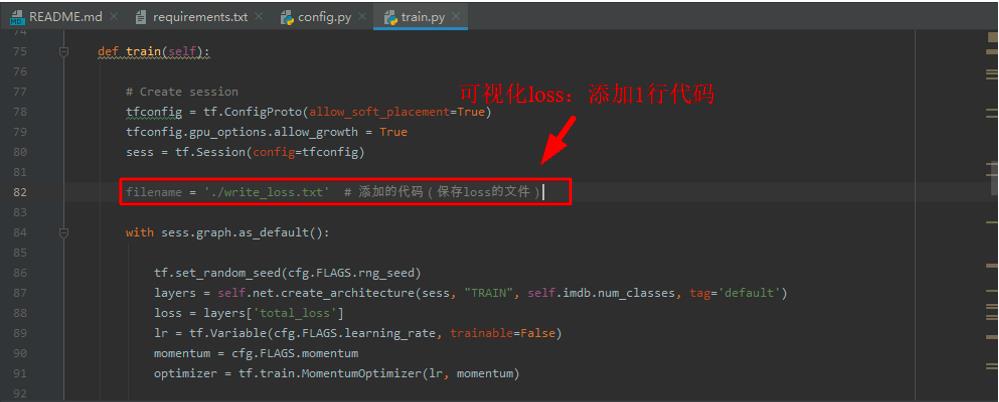
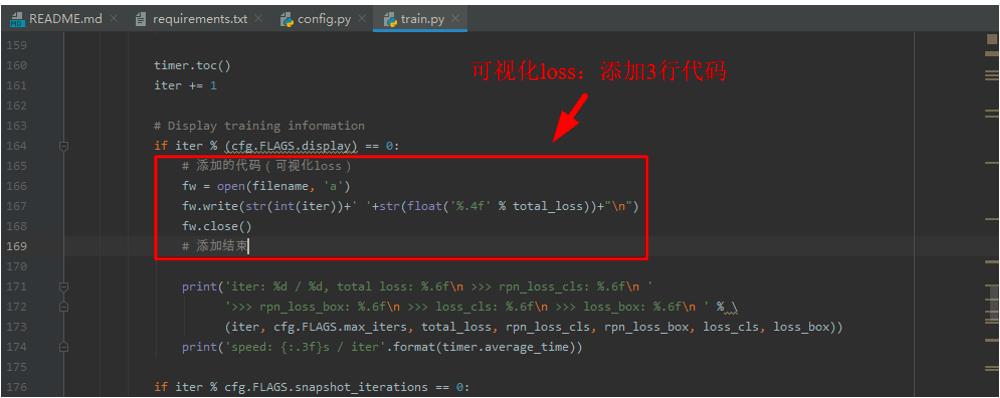
添加的代码如下所示。
filename = './write_loss.txt' # 添加的代码(保存loss的文件)
                # 添加的代码(可视化loss)
                fw = open(filename, 'a')
                fw.write(str(int(iter))+' '+str(float('%.4f' % total_loss))+"\\n")
                fw.close()
                # 添加结束
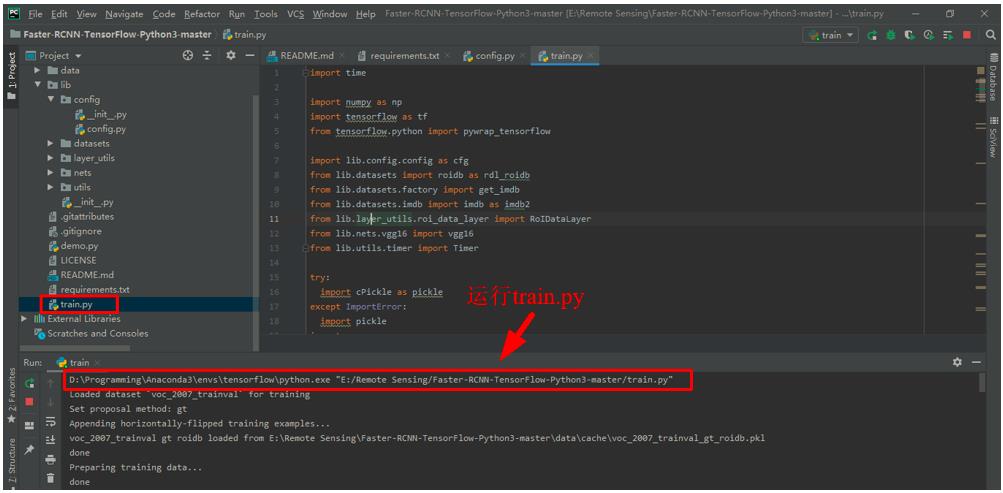
- 在
train.py文件界面,右击后点击Run 'train',开始训练。需要注意的是,每次训练前都要清空./data/cache和./default/voc_2007_trainval/default文件夹里面的文件。
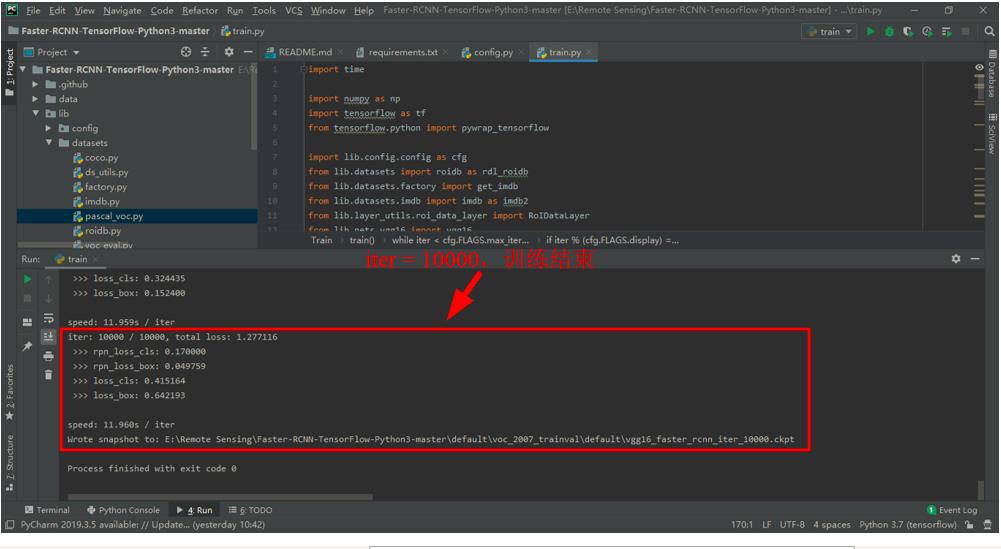
- 训练结束后,如果训练前在
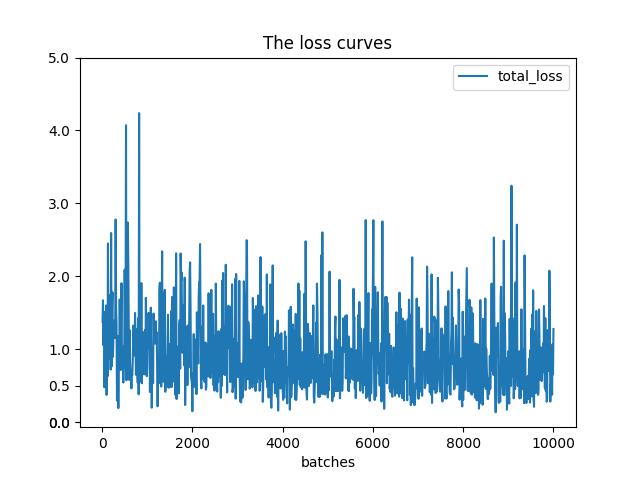
train.py文件中加了可视化loss的代码的话,可以在根路径下得到一个write_loss.txt,保存着每迭代10次对应的损失值。在根路径下新建一个Python文件visual_loss.py,代码如下,运行后可以在根目录下得到一张loss曲线图。
import numpy as np
import matplotlib.pyplot as plt

y_ticks = [0, 0, 0.5, 1.0, 2.0, 3.0, 4.0, 5.0]  # 纵坐标的值,可以自己设置。
data_path = 'E:/Remote Sensing/Faster-RCNN-TensorFlow-Python3-master/write_loss.txt'  # log_loss的路径
result_path = 'E:/Remote Sensing/Faster-RCNN-TensorFlow-Python3-master/total_loss'  # 保存结果的路径

data1_loss = np.loadtxt(data_path)
x = data1_loss[:, 0]  # 冒号左边是行范围,冒号右边列范围,取第一列
y = data1_loss[:, 1]  # 取第2列

# 开始画图
fig = plt.figure()
ax = fig.add_subplot(1, 1, 1)
ax.plot(x, y, label='total_loss')
plt.yticks(y_ticks)  # 如果不想自己设置纵坐标,可以注释掉
ax.legend(loc='best')
ax.set_title('The loss curves')
ax.set_xlabel('batches')
fig.savefig(result_path)
-
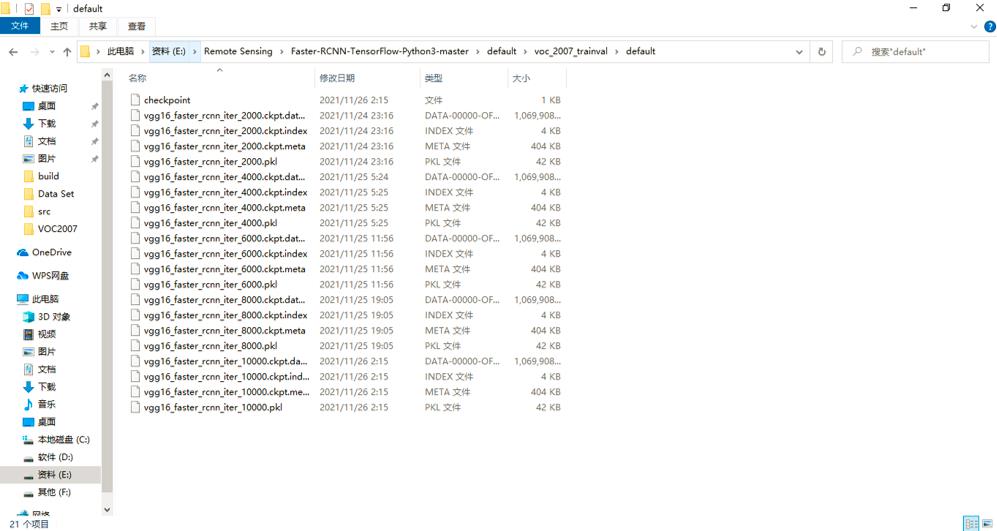
训练时,模型保存的路径是
./default/voc_2007_trainval/default,每次保存模型都是保存4个文件。
-
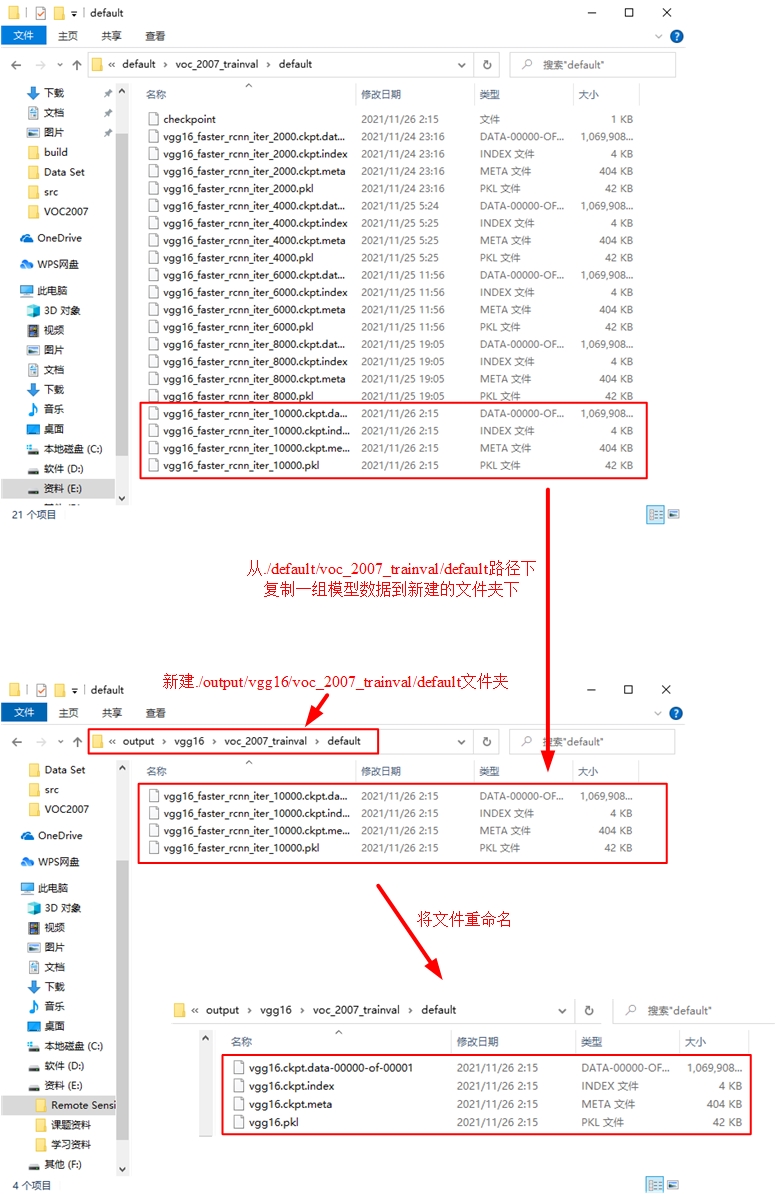
新建
./output/vgg16/voc_2007_trainval/default文件夹,从./default/voc_2007_trainval/default路径下复制一组模型数据到新建的文件夹下,并将所有文件名改为vgg16.后缀。
-
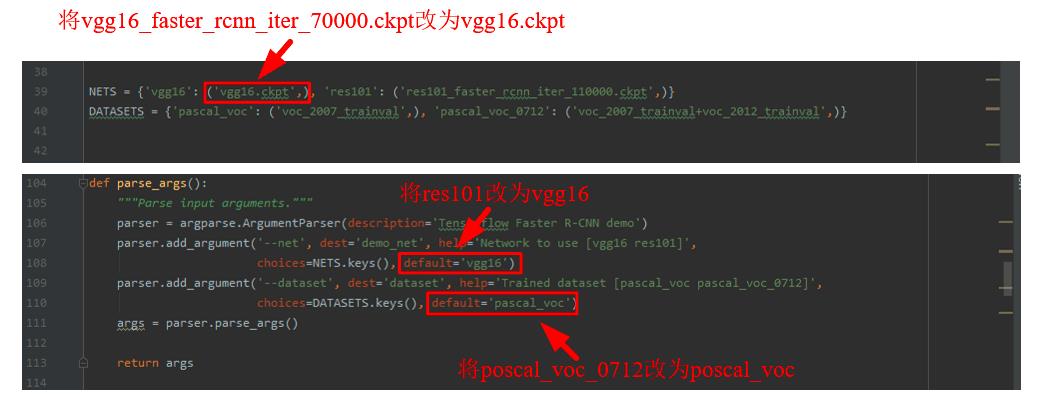
准备开始测试已经训练好的模型。在PyCharm中打开
demo.py文件,并进行如下修改。
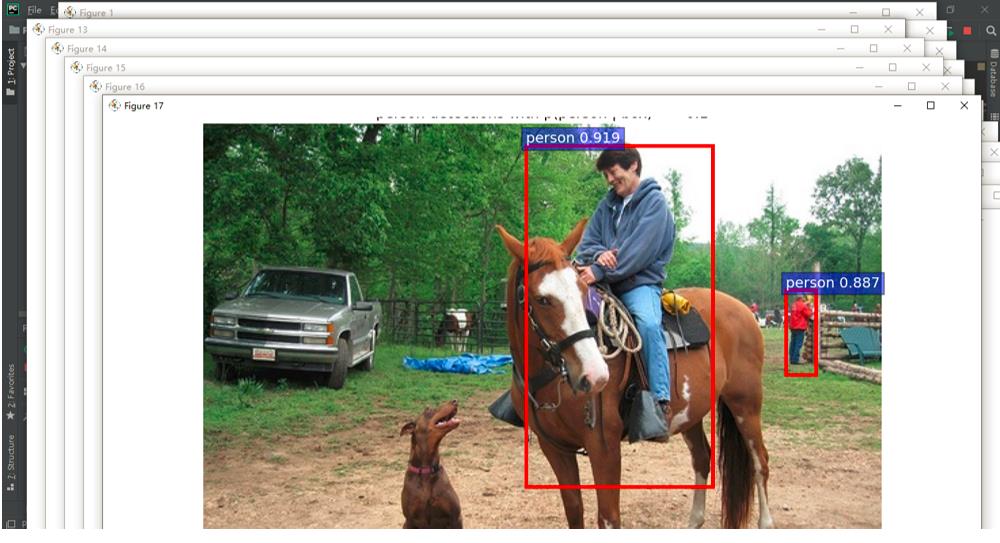
运行demo.py,可以得到./data/demo文件夹下的样例图片的目标检测结果。
-
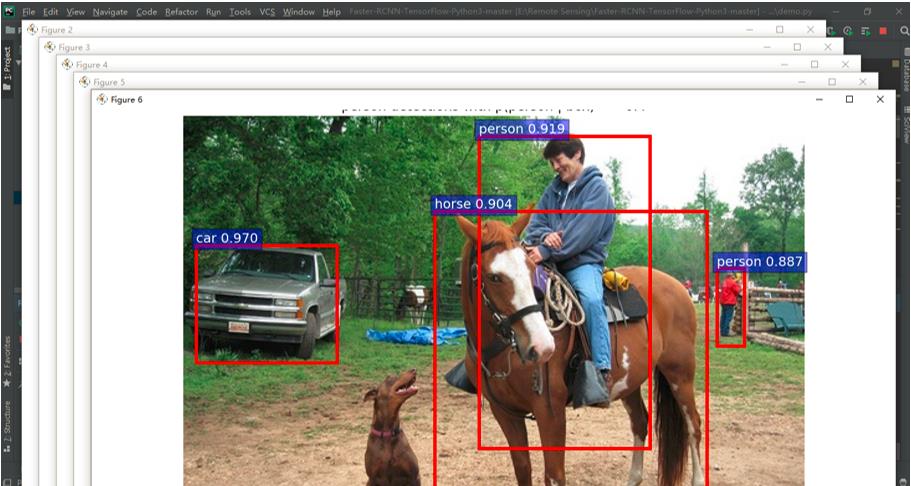
上述得到的结果中,对于同一幅图像,每个类别会显示一个窗口,因此会显示很多个图片窗口。如果想将同一张图片上的所有目标检测框全部在一张图片上显示出来的话,需要再次修改
demo.py文件如下所示的部分。


修改的代码如下所示。
# def vis_detections(im, class_name, dets, thresh=0.5):  # 修改这行代码为下面这行
def vis_detections(im, class_name, dets, ax, thresh=0.5):  # 添加的代码(增加ax参数)(将同一张图片上的所有目标检测框全部在一张图片上显示)
    """Draw detected bounding boxes."""
    inds = np.where(dets[:, -1] >= thresh)[0]
    if len(inds) == 0:
        return

    # 注释的代码(将同一张图片上的所有目标检测框全部在一张图片上显示)
    # im = im[:, :, (2, 1, 0)]
    # fig, ax = plt.subplots(figsize=(12, 12))
    # ax.imshow(im, aspect='equal')
    # 注释结束

    for i in inds:
        bbox = dets[i, :4]
        score = dets[i, -1]

        ax.add_patch(
            plt.Rectangle((bbox[0], bbox[1]),
                          bbox[2] - bbox[0],
                          bbox[3] - bbox[1], fill=False,
                          edgecolor='red', linewidth=3.5)
        )
        ax.text(bbox[0], bbox[1] - 2,
                ':s :.3f'.format(class_name, score),
                bbox=dict(facecolor='blue', alpha=0.5),
                fontsize=14, color='white')

    ax.set_title((' detections with '
                  'p( | box) >= :.1f').format(class_name, class_name,
                                                  thresh),
                 fontsize=14)
    # 注释的代码(将同一张图片上的所有目标检测框全部在一张图片上显示)
    # plt.axis('off')
    # plt.tight_layout()
    # plt.draw()
    # 注释结束

def demo(sess, net, image_name):
    """Detect object classes in an image using pre-computed object proposals."""

    # Load the demo image
    im_file = os.path.join(cfg.FLAGS2["data_dir"], 'demo', image_name)
    im = cv2.imread(im_file)

    # Detect all object classes and regress object bounds
    timer = Timer()
    timer.tic()
    scores, boxes = im_detect(sess, net, im)
    timer.toc()
    print('Detection took :.3fs for :d object proposals'.format(timer.total_time, boxes.shape[0]))

    # Visualize detections for each class
    CONF_THRESH = 0.4  # 进行适当修改
    NMS_THRESH = 0.2  # 进行适当修改
    # 添加的代码(复制前面注释掉的vis_detections函数中for循环之前的3行代码到此处)(将同一张图片上的所有目标检测框全部在一张图片上显示)
    im = im[:, :, (2, 1, 0)]
    fig, ax = plt.subplots(figsize=(12, 12))
    ax.imshow(im, aspect='equal')
    # 添加结束
    for cls_ind, cls in enumerate(CLASSES[1:]):
        cls_ind += 1  # because we skipped background
        cls_boxes = boxes[:, 4 * cls_ind:4 * (cls_ind + 1)]
        cls_scores = scores[:, cls_ind]
        dets = np.hstack((cls_boxes,
                          cls_scores[:, np.newaxis])).astype(np.float32)
        keep = nms(dets, NMS_THRESH)
        dets = dets[keep, :]
        # vis_detections(im, cls, dets, thresh=CONF_THRESH)  # 修改这行代码为下面这行
        vis_detections(im, cls, dets, ax,
                       thresh=CONF_THRESH)  # 添加的代码(将ax做为参数传入vis_detections)(将同一张图片上的所有目标检测框全部在一张图片上显示)
    # 添加的代码(复制前面注释掉的vis_detections函数中for循环之后的3行代码到此处)(将同一张图片上的所有目标检测框全部在一张图片上显示)
    plt.axis('off')
    plt.tight_layout()
    plt.draw()
    # 添加结束
-
再次运行
demo.py,可以重新得到./data/demo文件夹下的样例图片的目标检测结果。通过结果发现,所有画出来的候选框均在一幅图中标注出来。
-
如果想要在测试时输出PR曲线并计算AP值的话,首先需要在
.\\lib\\datasets路径下打开pascal_voc.py文件,做如下修改。


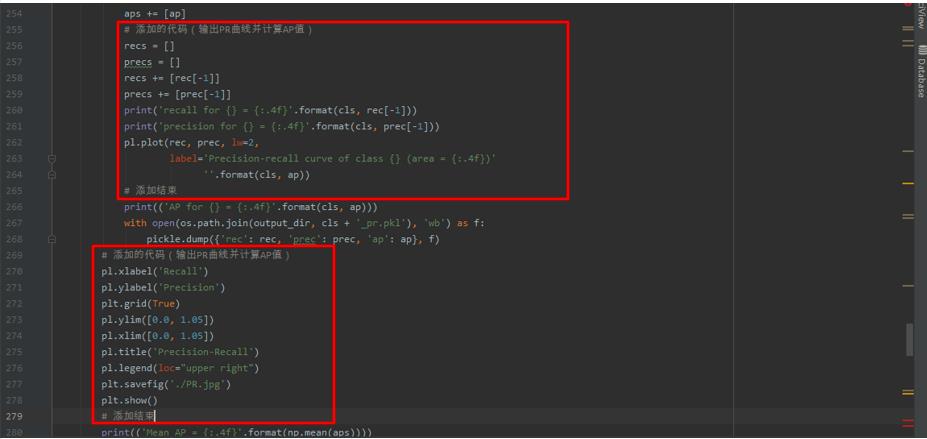

修改和添加的代码如下所示。
# 添加的代码(输出PR曲线并计算AP值)
import matplotlib.pyplot as plt
import pylab as pl
# 添加结束
        # filename = self._get_comp_id() + '_det_' + self._image_set + '_:s.txt'  # 修改这行代码为下面这行
        filename = self._image_set + '_:s'  # 添加的代码(输出PR曲线并计算AP值)
    def _do_python_eval(self, output_dir='output'):
        annopath = self._devkit_path + '\\\\VOC' + self._year + '\\\\Annotations\\\\' + ':s.xml'
        imagesetfile = os.path.join(
            self._devkit_path,
            'VOC' + self._year,
            'ImageSets',
            'Main',
            self._image_set + '.txt')
        cachedir = os.path.join(self._devkit_path, 'annotations_cache')
        aps = []
        # The PASCAL VOC metric changed in 2010
        use_07_metric = True if int(self._year) < 2010 else False
        print('VOC07 metric? ' + ('Yes' if use_07_metric else 'No'))
        if not os.path.isdir(output_dir):
            os.mkdir(output_dir)
        for i, cls in enumerate(self._classes):
            if cls == '__background__':
                continue
            filename = self._get_voc_results_file_template().format(cls)
            rec, prec, ap = voc_eval(
                filename, annopath, imagesetfile, cls, cachedir, ovthresh=0.5,
                use_07_metric=use_07_metric)
            aps += [ap]
            # 添加的代码(输出PR曲线并计算AP值)
            recs = []
            precs = []
            recs += [rec[-1]]
            precs += [prec[-1]]
            print('recall for  = :.4f'.format(cls, rec[-1]))
            print('precision for  = :.4f'.format(cls, prec[-1]))
            pl.plot(rec, prec, lw=2,
                    label='Precision-recall curve of class  (area = :.4f)'
                          ''.format(cls, ap))
            # 添加结束
            print(('AP for  = :.4f'.format(cls, ap)))
            with open(os.path.join(output_dir, cls + '_pr.pkl'), 'wb') as f:
                pickle.dump('rec': rec, 'prec': prec, 'ap': ap, f)
        # 添加的代码(输出PR曲线并计算AP值)
        pl.xlabel('Recall')
        pl.ylabel('Precision')
        plt.grid(True)
        pl.ylim([0.0, 1.05])
        pl.xlim([0.0, 1.05])
        pl.title('Precision-Recall')
        pl.legend(loc="upper right")
        plt.savefig('./PR.jpg')
        plt.show()
        # 添加结束
        print(('Mean AP = :.4f'.format(np.mean(aps))))
        print('~~~~~~~~')
        print('Results:')
        for ap in aps:
            print((':.3f'.format(ap)))
        print((':.3f'.format(np.mean(aps))))
        print('~~~~~~~~')
        print('')
        print('--------------------------------------------------------------')
        print('Results computed with the **unofficial** Python eval code.')
        print('Results should be very close to the official MATLAB eval code.')
        print('Recompute with `./tools/reval.py --matlab ...` for your paper.')
        print('-- Thanks, The Management')
        print('--------------------------------------------------------------')
- 然后在
.\\lib\\datasets路径下打开voc_eval.py文件,做如下修改。

修改的代码如下所示。
    # tree = ET.parse(filename)  # 修改这行代码为下面这行
    tree = ET.parse('' + filename)  # 添加的代码(输入PR曲线并计算AP值)
- 最后在根路径下新建
test_net.py文件,代码如下所示。
""""
Demo script showing detections in sample images.
See README.md for installation instructions before running.
"""
from __future__ import absolute_import
from __future__ import division
from __future__ import print_function
import argparse
import os
import tensorflow as tf
from lib.nets.vgg16 import vgg16
from lib.datasets.factory import get_imdb
from lib.utils.test import test_net
NETS = 'vgg16': ('vgg16.ckpt',) # 自己需要修改:训练输出模型
DATASETS = 'pascal_voc': ('voc_2007_trainval',), 'pascal_voc_0712': ('voc_2007_trainval+voc_2012_trainval',)
def parse_args():
"""Parse input arguments."""
parser = argparse.ArgumentParser(description='Tensorflow Faster R-CNN test')
parser.add_argument('--net', dest='demo_net', help='Network to use [vgg16 res101]',
choices=NETS.keys(), default='vgg16')
parser.add_argument('--dataset', dest='dataset', help='Trained dataset [pascal_voc pascal_voc_0712]',
choices=DATASETS.keys(), default='pascal_voc')
args = parser.parse_args()
return args
if __name__ == '__main__':
args = parse_args()
# model path
demonet = args.demo_net
dataset = args.dataset
tfmodel = os.path.join('output', demonet, DATASETS[dataset][0], 'default', NETS[demonet][0]) # 模型路径
# 获得模型文件名称
filename = (os.path.splitext(tfmodel)[0]).split('\\\\')[-1]
filename = 'default' + '/' + filename
imdb = get_imdb("voc_2007_test") # 得到
imdb.competition_mode('competition mode')
if not os.path.isfile(tfmodel + '.meta'):
print(tfmodel)
raise IOError((':s not found.\\nDid you download the proper networks from '
'our server and place them properly?').format(tfmodel + '.meta'))
# set config
tfconfig = tf.ConfigProto(allow_soft_placement=True)
tfconfig.gpu_options.allow_growth = True
# init session
sess = tf.Session(config=tfconfig)
# load network
if demonet == 'vgg16':
net = vgg16(batch_size=1)
# elif demonet == 'res101':
# net = resnetv1(batch_size=1, num_layers=101)
else:
raise NotImplementedError
net.create_architecture(sess, "TEST", 21, # 自己需要修改:类别数量+1
tag='default', anchor_scales=[8, 16, 32])
saver = tf.以上是关于Windows10+Faster-RCNN-TensorFlow-Python3-master+VOC2007数据集的主要内容,如果未能解决你的问题,请参考以下文章
Windows 10上的IE 11 VS 10上的Windows 11
Windows 11 即将问世 | Windows 10 和 Windows 11 该如何抉择