机器学习——决策树(下)算法实现
Posted Lyndon_zheng
tags:
篇首语:本文由小常识网(cha138.com)小编为大家整理,主要介绍了机器学习——决策树(下)算法实现相关的知识,希望对你有一定的参考价值。
Decision tree
在机器学习(5)——决策树(上)原理中介绍了决策树的生成和剪枝原理。介绍了CART,ID3,C4.5等算法的算法流程,其中CART算法可以实现回归和分类,是基于基尼不纯度实现的,这里并未实现。这里主要实现了ID3和C4.5算法,是基于信息熵的,在本处因为没有涉及剪枝,他们最终得到的结果都是一样的。我们先来看ID3的整个算法框架(C4.5也基本类似,不同之处是特征选取的区别):
- Algotithm 4.1 ID3(D)
- Input: an attribute-valued dataset D
- Output: a decision tree
- if
D is “pure” OR Attribute is null then - return class
- end if
- for all attribute a∈D do
- computer the imformation gain and select best feature
- end for
- abest= Best attribute feature
- Tree= Create a decision node that feature abest in root
- Dv= Induced sub-dataset for feature abest
- for all Dv do
- Treev=ID3(Dv)
- end for
- return Tree
- if
算法实现
(1)创建训练数据集:
从.txt文件中读取数据,并去掉空格,分割数据,最终返回dataset数据集合attribute特征类别。
# process training data set
# input: directory
# output: data_set, attribute

def proData(path):
    fileset = open(path)   #loading data file
    dataset = [data.strip().split('\\t') for data in fileset.readlines()]
    attribute = dataset [0]
    del(dataset[0])
    return dataset,attribute
(2)计算信息熵:
先统计训练数据的总量,然后统计每个标签类别的数目,得到其概率,最后计算信息熵
# calculate the information entropy
# input: dataset
# output: entropy

def calcEntropy(dataset):
    numEntries = len (dataset)
    attributeCounts =
    for item in dataset:
        currentAttribute = item[-1]
        if currentAttribute not in attributeCounts.keys():
            attributeCounts[currentAttribute]=0
        attributeCounts[currentAttribute]+=1
    entropy = 0.0
    for key in attributeCounts:
        prob = float (attributeCounts[key])/numEntries
        entropy -= prob *log(prob,2)
    return entropy
(3)划分子数据集:
选取最好的分类特征之后,依据该特征得到新的子训练样本,将子样本进行归类,并去掉本次已选的属性(特征)。
# split data based on different values of attribute
# input: dataset
# output: split data
def splitData(dataset,axis,value):
    splitdata = []
    for feature in dataset:
        if feature[axis] == value:
            #del(feature[axis])
            tempFeaVec = feature[:axis]
            tempFeaVec.extend(feature[axis+1:])
            splitdata.append(tempFeaVec)
    return splitdata
(4)选取最好特征:
在ID3算法中,依据信息增益选取最好的特征,在C4.5中依据信息增益比选取最好特征。
ID3:信息增益
# calculate the entropy of different features
# input: dataset
# output: best feature
def selectBestFeature(dataset):
    numFeatures = len(dataset[0]) - 1
    baseEntropy = calcEntropy(dataset)
    bestInfoGain = 0.0; bestFeature = -1
    for i in range(numFeatures):
        featList = [features[i] for features in dataset] # Select attribute types
        uniqueVals = set(featList)                       # Set different values of same attribute
        newEntropy = 0.0
        for value in uniqueVals:
            subDataSet = splitData(dataset, i, value)
            prob = float(len(subDataSet))/len(dataset)
            newEntropy += prob * calcEntropy(subDataSet)
        infoGain = baseEntropy - newEntropy
        if (infoGain > bestInfoGain):
            bestInfoGain = infoGain
            bestFeature = i
    return bestFeature
C4.5:信息增益率
# calculate the information gain ratio for different features
# input: dataset
# output: best feature
def selectBestFeature_C4(dataset):
    numFeatures = len(dataset[0]) - 1
    baseEntropy = calcEntropy(dataset)
    bestInfoGainRatio = 0.0; bestFeature = -1
    for i in range(numFeatures):
        featList = [features[i] for features in dataset] # Select attribute types
        uniqueVals = set(featList)                       # Set different values of same attribute
        newEntropy = 0.0;Splitentropy = 0.0
        for value in uniqueVals:
            subDataSet = splitData(dataset, i, value)
            prob = float(len(subDataSet))/len(dataset)
            newEntropy += prob * calcEntropy(subDataSet)
            Splitentropy -= prob *log(prob,2)
        infoGainRatio = (baseEntropy - newEntropy)/Splitentropy
        if (infoGainRatio > bestInfoGainRatio):
            bestInfoGainRatio = infoGainRatio
            bestFeature = i
    return bestFeature
(5)创建决策树:
首先计算所有属性(特征)对于原经验熵的信息增益(率),据此选取出最好的属性(特征),然后根据所选的最好属性(特征)将原数据集分成不同的子数据集,并迭代计算子数据集的树,直到子数据集不可分或属性集合为空为止。
ID3决策树生成
# train decision tree ID3
# input: dataset, attribute
# output: decision tree
def createTreeID3(dataset,attributes):
    classList = [example[-1] for example in dataset]
    classCount =
    if classList.count(classList[0]) ==len(classList):
        return classList[0]                             # stop splitting when all data belong to same labels
    if len(dataset[0]) == 1:                            # stop splitting when attribute = NULL, return the max class
        for value in classList:
            if value not in classCount.keys():
                classCount[value] = 0
            classCount[value]+=1
        sortedClassCount = sorted(classCount.iteritems(), key = operator.itemgetter(1), reverse = True)
        return sortedClassCount[0][0]
    bestFeature = selectBestFeature(dataset)
    bestAttribute = attributes [bestFeature]
    myTree = bestAttribute:
    del(attributes [bestFeature])
    featureValues = [example[bestFeature] for example in dataset] # select the training data of the child node
    uniqueVals = set(featureValues)
    for value in uniqueVals:
        subattributes = attributes[:]
        myTree[bestAttribute][value] = createTreeID3(splitData(dataset, bestFeature, value), subattributes)
    return myTree
C4.5决策树生成
# train decision tree C4.5
# input: dataset, attribute
# output: decision tree
def createTreeC4(dataset,attributes):
    classList = [example[-1] for example in dataset]
    classCount =
    if classList.count(classList[0]) == len(classList):
        return classList[0]
    if len(dataset[0]) == 1:
        for value in classList:
            if value not in classCount.keys():
                classCount[value] = 0
            classCount[value] +=1
        sortedClassCount = sorted(classCount.iteritems(), key = operator.itemgetter(1), reverse = True)
        return sortedClassCount[0][0]
    bestFeature = selectBestFeature_C4(dataset)
    bestAttribute = attributes [bestFeature]
    myTree = bestAttribute:
    del(attributes [bestFeature])
    featureValues = [example[bestFeature] for example in dataset] # select the training data of the child node
    uniqueVals = set(featureValues)
    for value in uniqueVals:
        subattributes = attributes[:]
        myTree[bestAttribute][value] = createTreeC4(splitData(dataset, bestFeature, value), subattributes)
    return myTree
(6)主函数:
给定数据所在位置,并输出最终的效果。
# main function
if __name__=="__main__":
    # data_set processing
    dataset = []
    attributes = []
    path='F:\\Program\\Python\\Machine_Learning\\Decision_tree\\lenses.txt'
    dataset,attributes = proData(path)
    myTreeID3 = createTreeID3(dataset,attributes)
    dataset,attributes = proData(path)
    myTreeC4 = createTreeC4(dataset, attributes)
    print str(myTreeID3)
    createPlot(myTreeID3)
    print str(myTreeC4)
    createPlot(myTreeC4)
(7)画图函数:
生成的决策树通过文本形式观看不是很直观,设计一个画图子函数之后,可以很直观的将生成的决策树打印出来,看到不错的效果。
# Project: Machine learning-decision tree
# Author: Lyndon
# date: 2015/10/27

from matplotlib import pyplot as plt

# define the format of text and arrow
decisionNode = dict(boxstyle ="sawtooth",fc = "0.8")
leafNode = dict(boxstyle = "round4", fc = "0.8")
arrowRrgs = dict (arrowstyle = "<-")

# calculate the number of tree leaves and the depth of tree
# input: decision tree
# output: numbers of node, depth of the tree
def calNumLeaves(tree):
    numLeaves = 0
    maxDepth = 0
    firstNode = tree.keys()[0]
    secondDict = tree[firstNode]
    for key in secondDict.keys():
        if type(secondDict[key]).__name__ == 'dict':        #check if the node is leaf
            subnumLeaves,submaxDepth = calNumLeaves(secondDict[key])
            numLeaves += subnumLeaves
            thisDepth = 1 +submaxDepth
        else:
            numLeaves +=1
            thisDepth = 1
        if thisDepth > maxDepth:
            maxDepth = thisDepth
    return numLeaves,maxDepth

# plot the node and leaf
# input: node,leaf, center, parent,
# output: null
def plotsubtree(node,text,center,parent,nodeType):
    createPlot.ax1.annotate(node,xy=parent,xycoords='axes fraction',
                            xytext=center,textcoords='axes fraction',
                            va='center',ha='center',bbox=nodeType,arrowprops=arrowRrgs)
    xMid = (parent[0]-center[0])/2.0+center[0]
    yMid = (parent[1]-center[1])/2.0+center[1]
    createPlot.ax1.text(xMid,yMid,text,va='center',ha='center',rotation=30)

# plot the tree
# input: tree
# output: null
def plotTree(tree,parent,nodetxt):
    numLeaves, depth = calNumLeaves(tree)
    firstNode = tree.keys()[0]
    center = (plotTree.xOff+(1+float(numLeaves))/2.0/plotTree.num,plotTree.yOff )
    plotsubtree(firstNode, nodetxt, center, parent, decisionNode)
    secondDict = tree[firstNode]
    plotTree.yOff -=1.0/plotTree.depth
    for key in secondDict.keys():
        if type(secondDict[key]).__name__ == 'dict':
            plotTree(secondDict[key], center, str(key))
        else:
            plotTree.xOff += 1.0/plotTree.num
            plotsubtree(secondDict[key], str(key), (plotTree.xOff,plotTree.yOff), center, leafNode)
    plotTree.yOff += 1.0/plotTree.depth

# plot the Tree
# input: Tree
# output: Null
def createPlot(tree):
    fig = plt.figure(1,facecolor='white')
    fig.clf()
    axprops = dict(xticks=[],yticks=[])
    createPlot.ax1 = plt.subplot(111,frameon=False,**axprops)
    plotTree.num, plotTree.depth = calNumLeaves(tree)
    plotTree.xOff = -0.5/plotTree.num; plotTree.yOff = 1.0
    plotTree(tree,(0.5,1.0),'')
    plt.show()
(8)分类结果:
决策树文本输出:
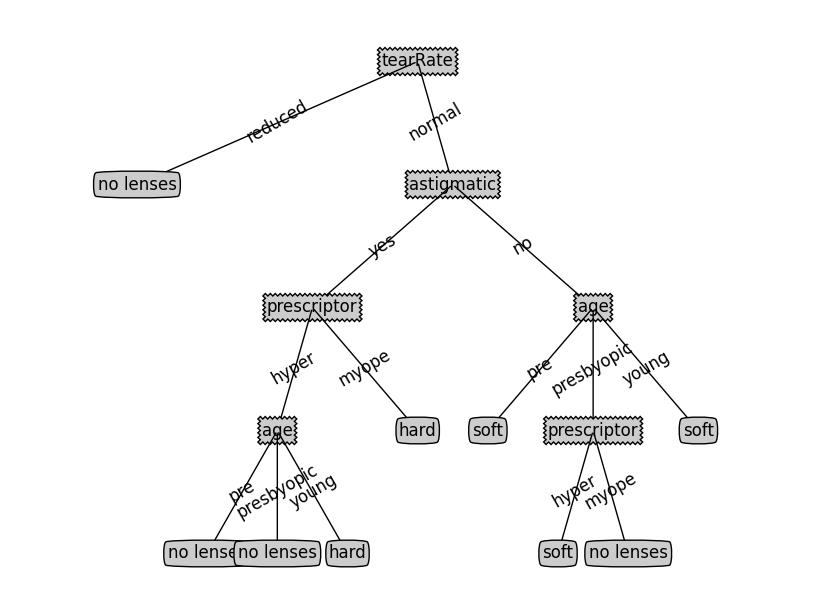
‘tearRate’‘reduced’: ‘no lenses’, ‘normal’: ‘astigmatic’: ‘yes’: ‘prescriptor’: ‘hyper’: ‘age’: ‘pre’: ‘no lenses’, ‘presbyopic’: ‘no lenses’, ‘young’: ‘hard’, ‘myope’: ‘hard’, ‘no’: ‘age’: ‘pre’: ‘soft’, ‘presbyopic’: ‘prescriptor’: ‘hyper’: ‘soft’, ‘myope’: ‘no lenses’, ‘young’: ‘soft’
决策树图示:

在本例中,没有剪枝过程,ID3和C4.5算法实现的最终结果一样。
PS:
本文主要通过Python实现了决策树中的ID3和C4.5算法,只是简单的应用了信息增益和信息增益率来实现分类,代码参考了《机器学习实战》,完整代码及数据。
以上是关于机器学习——决策树(下)算法实现的主要内容,如果未能解决你的问题,请参考以下文章