Python基础 | 还不会python绘图?两万字博文教你Matplotlib库(超详细总结)
Posted timerring
tags:
篇首语:本文由小常识网(cha138.com)小编为大家整理,主要介绍了Python基础 | 还不会python绘图?两万字博文教你Matplotlib库(超详细总结)相关的知识,希望对你有一定的参考价值。
⭐本专栏旨在对Python的基础语法进行详解,精炼地总结语法中的重点,详解难点,面向零基础及入门的学习者,通过专栏的学习可以熟练掌握python编程,同时为后续的数据分析,机器学习及深度学习的代码能力打下坚实的基础。
🔥本文已收录于Python基础系列专栏: Python基础系列教程 欢迎订阅,持续更新。


文章目录
13.0 环境配置
【1】 要不要plt.show()
-
ipython中可用魔术方法 %matplotlib inline
-
pycharm 中必须使用plt.show()
%matplotlib inline # 配置,可以再ipython中生成就显示,而不需要多余plt.show来完成。
import matplotlib.pyplot as plt
plt.style.use("seaborn-whitegrid") # 用来永久地改变风格,与下文with临时改变进行对比
x = [1, 2, 3, 4]
y = [1, 4, 9, 16]
plt.plot(x, y)
plt.ylabel("squares")
# plt.show()
Text(0, 0.5, 'squares')

【2】设置样式
plt.style.available[:5]
['bmh', 'classic', 'dark_background', 'fast', 'fivethirtyeight']
临时地改变风格,采用with这个上下文管理器。
with plt.style.context("seaborn-white"):
    plt.plot(x, y)

【3】将图像保存为文件
import numpy as np
x = np.linspace(0, 10 ,100)
plt.plot(x, np.exp(x))
plt.savefig("my_figure.png")

13.1 Matplotlib库

13.1.1 折线图
%matplotlib inline
import matplotlib.pyplot as plt
plt.style.use("seaborn-whitegrid")
import numpy as np
x = np.linspace(0, 2*np.pi, 100)
plt.plot(x, np.sin(x))
[<matplotlib.lines.Line2D at 0x18846169780>]

- 绘制多条曲线
x = np.linspace(0, 2*np.pi, 100)
plt.plot(x, np.cos(x))
plt.plot(x, np.sin(x))
[<matplotlib.lines.Line2D at 0x1884615f9e8>]

【1】调整线条颜色和风格
- 调整线条颜色
offsets = np.linspace(0, np.pi, 5)
colors = ["blue", "g", "r", "yellow", "pink"]
for offset, color in zip(offsets, colors):
    plt.plot(x, np.sin(x-offset), color=color)         # color可缩写为c

- 调整线条风格
x = np.linspace(0, 10, 11)
offsets = list(range(8))
linestyles = ["solid", "dashed", "dashdot", "dotted", "-", "--", "-.", ":"]
for offset, linestyle in zip(offsets, linestyles):
    plt.plot(x, x+offset, linestyle=linestyle)        # linestyle可简写为ls

- 调整线宽
x = np.linspace(0, 10, 11)
offsets = list(range(0, 12, 3))
linewidths = (i*2 for i in range(1,5))
for offset, linewidth in zip(offsets, linewidths):
    plt.plot(x, x+offset, linewidth=linewidth)                 # linewidth可简写为lw

- 调整数据点标记
marker设置坐标点
x = np.linspace(0, 10, 11)
offsets = list(range(0, 12, 3))
markers = ["*", "+", "o", "s"]
for offset, marker in zip(offsets, markers):
    plt.plot(x, x+offset, marker=marker)

markersize 设置坐标点大小
x = np.linspace(0, 10, 11)
offsets = list(range(0, 12, 3))
markers = ["*", "+", "o", "s"]
for offset, marker in zip(offsets, markers):
    plt.plot(x, x+offset, marker=marker, markersize=10)      # markersize可简写为ms

颜色跟风格设置的简写 color_linestyles = [“g-”, “b–”, “k-.”, “r:”]
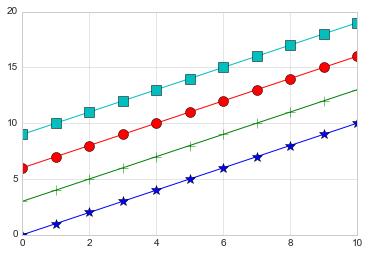
x = np.linspace(0, 10, 11)
offsets = list(range(0, 8, 2))
color_linestyles = ["g-", "b--", "k-.", "r:"]
for offset, color_linestyle in zip(offsets, color_linestyles):
    plt.plot(x, x+offset, color_linestyle)

颜色_风格_线性 设置的简写 color_marker_linestyles = [“g*-”, “b±-”, “ko-.”, “rs:”]
x = np.linspace(0, 10, 11)
offsets = list(range(0, 8, 2))
color_marker_linestyles = ["g*-", "b+--", "ko-.", "rs:"]
for offset, color_marker_linestyle in zip(offsets, color_marker_linestyles):
    plt.plot(x, x+offset, color_marker_linestyle)

其他用法及颜色缩写、数据点标记缩写等请查看官方文档,如下:
https://matplotlib.org/api/_as_gen/matplotlib.pyplot.plot.html#matplotlib.pyplot.plot
【2】调整坐标轴
- xlim, ylim # 限制x,y轴
x = np.linspace(0, 2*np.pi, 100)
plt.plot(x, np.sin(x))
plt.xlim(-1, 7)
plt.ylim(-1.5, 1.5)
(-1.5, 1.5)

- axis
x = np.linspace(0, 2*np.pi, 100)
plt.plot(x, np.sin(x))
plt.axis([-2, 8, -2, 2])
[-2, 8, -2, 2]

tight 会紧凑一点
x = np.linspace(0, 2*np.pi, 100)
plt.plot(x, np.sin(x))
plt.axis("tight")
(0.0, 6.283185307179586, -0.9998741276738751, 0.9998741276738751)

equal 会松一点
x = np.linspace(0, 2*np.pi, 100)
plt.plot(x, np.sin(x))
plt.axis("equal")
(0.0, 7.0, -1.0, 1.0)

?plt.axis # 可以查询其中的功能
Object `plt.axis # 可以查询其中的功能` not found.
- 对数坐标
x = np.logspace(0, 5, 100)
plt.plot(x, np.log(x))
plt.xscale("log")

- 调整坐标轴刻度
plt.xticks(np.arange(0, 12, step=1))
x = np.linspace(0, 10, 100)
plt.plot(x, x**2)
plt.xticks(np.arange(0, 12, step=1))
([<matplotlib.axis.XTick at 0x18846412828>,
  <matplotlib.axis.XTick at 0x18847665898>,
  <matplotlib.axis.XTick at 0x18847665630>,
  <matplotlib.axis.XTick at 0x18847498978>,
  <matplotlib.axis.XTick at 0x18847498390>,
  <matplotlib.axis.XTick at 0x18847497d68>,
  <matplotlib.axis.XTick at 0x18847497748>,
  <matplotlib.axis.XTick at 0x18847497438>,
  <matplotlib.axis.XTick at 0x1884745f438>,
  <matplotlib.axis.XTick at 0x1884745fd68>,
  <matplotlib.axis.XTick at 0x18845fcf4a8>,
  <matplotlib.axis.XTick at 0x18845fcf320>],
 <a list of 12 Text xticklabel objects>)

x = np.linspace(0, 10, 100)
plt.plot(x, x**2)
plt.xticks(np.arange(0, 12, step=1), fontsize=15)
plt.yticks(np.arange(0, 110, step=10))
([<matplotlib.axis.YTick at 0x188474f0860>,
  <matplotlib.axis.YTick at 0x188474f0518>,
  <matplotlib.axis.YTick at 0x18847505a58>,
  <matplotlib.axis.YTick at 0x188460caac8>,
  <matplotlib.axis.YTick at 0x1884615c940>,
  <matplotlib.axis.YTick at 0x1884615cdd8>,
  <matplotlib.axis.YTick at 0x1884615c470>,
  <matplotlib.axis.YTick at 0x1884620c390>,
  <matplotlib.axis.YTick at 0x1884611f898>,
  <matplotlib.axis.YTick at 0x188461197f0>,
  <matplotlib.axis.YTick at 0x18846083f98>],
 <a list of 11 Text yticklabel objects>)

- 调整刻度样式
plt.tick_params(axis=“both”, labelsize=15)
x = np.linspace(0, 10, 100)
plt.plot(x, x**2)
plt.tick_params(axis="both", labelsize=15)

【3】设置图形标签
x = np.linspace(0, 2*np.pi, 100)
plt.plot(x, np.sin(x))
plt.title("A Sine Curve", fontsize=20)
plt.xlabel("x", fontsize=15)
plt.ylabel("sin(x)", fontsize=15)
Text(0, 0.5, 'sin(x)')

【4】设置图例
- 默认
x = np.linspace(0, 2*np.pi, 100)
plt.plot(x, np.sin(x), "b-", label="Sin")
plt.plot(x, np.cos(x), "r--", label="Cos")
plt.legend()
<matplotlib.legend.Legend at 0x1884749f908>

- 修饰图例
import matplotlib.pyplot as plt
import numpy as np
x = np.linspace(0, 2*np.pi, 100)
plt.plot(x, np.sin(x), "b-", label="Sin")
plt.plot(x, np.cos(x), "r--", label="Cos")
plt.ylim(-1.5, 2)
plt.legend(loc="upper center", frameon=True, fontsize=15) # frameon=True增加图例的边框
<matplotlib.legend.Legend at 0x19126b53b80>

【5】添加文字和箭头
- 添加文字
x = np.linspace(0, 2*np.pi, 100)
plt.plot(x, np.sin(x), "b-")
plt.text(3.5, 0.5, "y=sin(x)", fontsize=15) # 前两个为文字的坐标,后面是内容和字号
Text(3.5, 0.5, 'y=sin(x)')

- 添加箭头
x = np.linspace(0, 2*np.pi, 100)
plt.plot(x, np.sin(x), "b-")
plt.annotate('local min', xy=(1.5*np.pi, -1), xytext=(4.5, 0),
             arrowprops=dict(facecolor='black', shrink=0.1),
             )
Text(4.5, 0, 'local min')

13.1.2 散点图
【1】简单散点图
x = np.linspace(0, 2*np.pi, 20)
plt.scatter(x, np.sin(x), marker="o", s=30, c="r")    # s 大小  c 颜色
<matplotlib.collections.PathCollection at 0x188461eb4a8>

【2】颜色配置
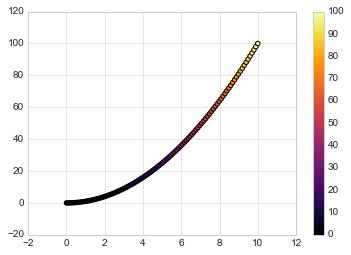
x = np.linspace(0, 10, 100)
y = x**2
plt.scatter(x, y, c=y, cmap="inferno")  # 让c随着y的值变化在cmap中进行映射
plt.colorbar() # 输出颜色条
<matplotlib.colorbar.Colorbar at 0x18848d392e8>

颜色配置参考官方文档
https://matplotlib.org/examples/color/colormaps_reference.html
【3】根据数据控制点的大小
x, y, colors, size = (np.random.rand(100) for i in range(4))
plt.scatter(x, y, c=colors, s=1000*size, cmap="viridis")
<matplotlib.collections.PathCollection at 0x18847b48748>

【4】透明度
x, y, colors, size = (np.random.rand(100) for i in range(4))
plt.scatter(x, y, c=colors, s=1000*size, cmap="viridis", alpha=0.3)
plt.colorbar()
<matplotlib.colorbar.Colorbar at 0x18848f2be10>

【例】随机漫步
from random import choice

class RandomWalk():
    """一个生产随机漫步的类"""
    def __init__(self, num_points=5000):
        self.num_points = num_points
        self.x_values = [0]
        self.y_values = [0]

    def fill_walk(self):
        while len(self.x_values) < self.num_points:
            x_direction = choice([1, -1])
            x_distance = choice([0, 1, 2, 3, 4])
            x_step = x_direction * x_distance

            y_direction = choice([1, -1])
            y_distance = choice([0, 1, 2, 3, 4])
            y_step = y_direction * y_distance

            if x_step == 0 or y_step == 0:
                continue
            next_x = self.x_values[-1] + x_step
            next_y = self.y_values[-1] + y_step
            self.x_values.append(next_x)
            self.y_values.append(next_y)
rw = RandomWalk(10000)
rw.fill_walk()
point_numbers = list(range(rw.num_points))
plt.figure(figsize=(12, 6))        # 设置画布大小
plt.scatter(rw.x_values, rw.y_values, c=point_numbers, cmap="inferno", s=1)
plt.colorbar()
plt.scatter(0, 0, c="green", s=100)
plt.scatter(rw.x_values[-1], rw.y_values[-1], c="red", s=100)

plt.xticks([])
plt.yticks([])
([], <a list of 0 Text yticklabel objects>)

13.1.3 柱形图
【1】简单柱形图
x = np.arange两万字博文教你python爬虫requests库,看完还不会我把我女朋友都给你❤️熬夜整理&建议收藏❤️
两万字博文教你python爬虫requests库,看完还不会我把我女朋友都给你❤️熬夜整理&建议收藏❤️
零基础开始学python怎么才能月薪两万?这篇文章告诉你答案!
还不会Python数据可视化? 手把手教你用 Matplotlib 实现数据可视化(珍藏版)