Node实现切片的拼接和地图的导出
Posted 牛老师讲GIS
tags:
篇首语:本文由小常识网(cha138.com)小编为大家整理,主要介绍了Node实现切片的拼接和地图的导出相关的知识,希望对你有一定的参考价值。
概述
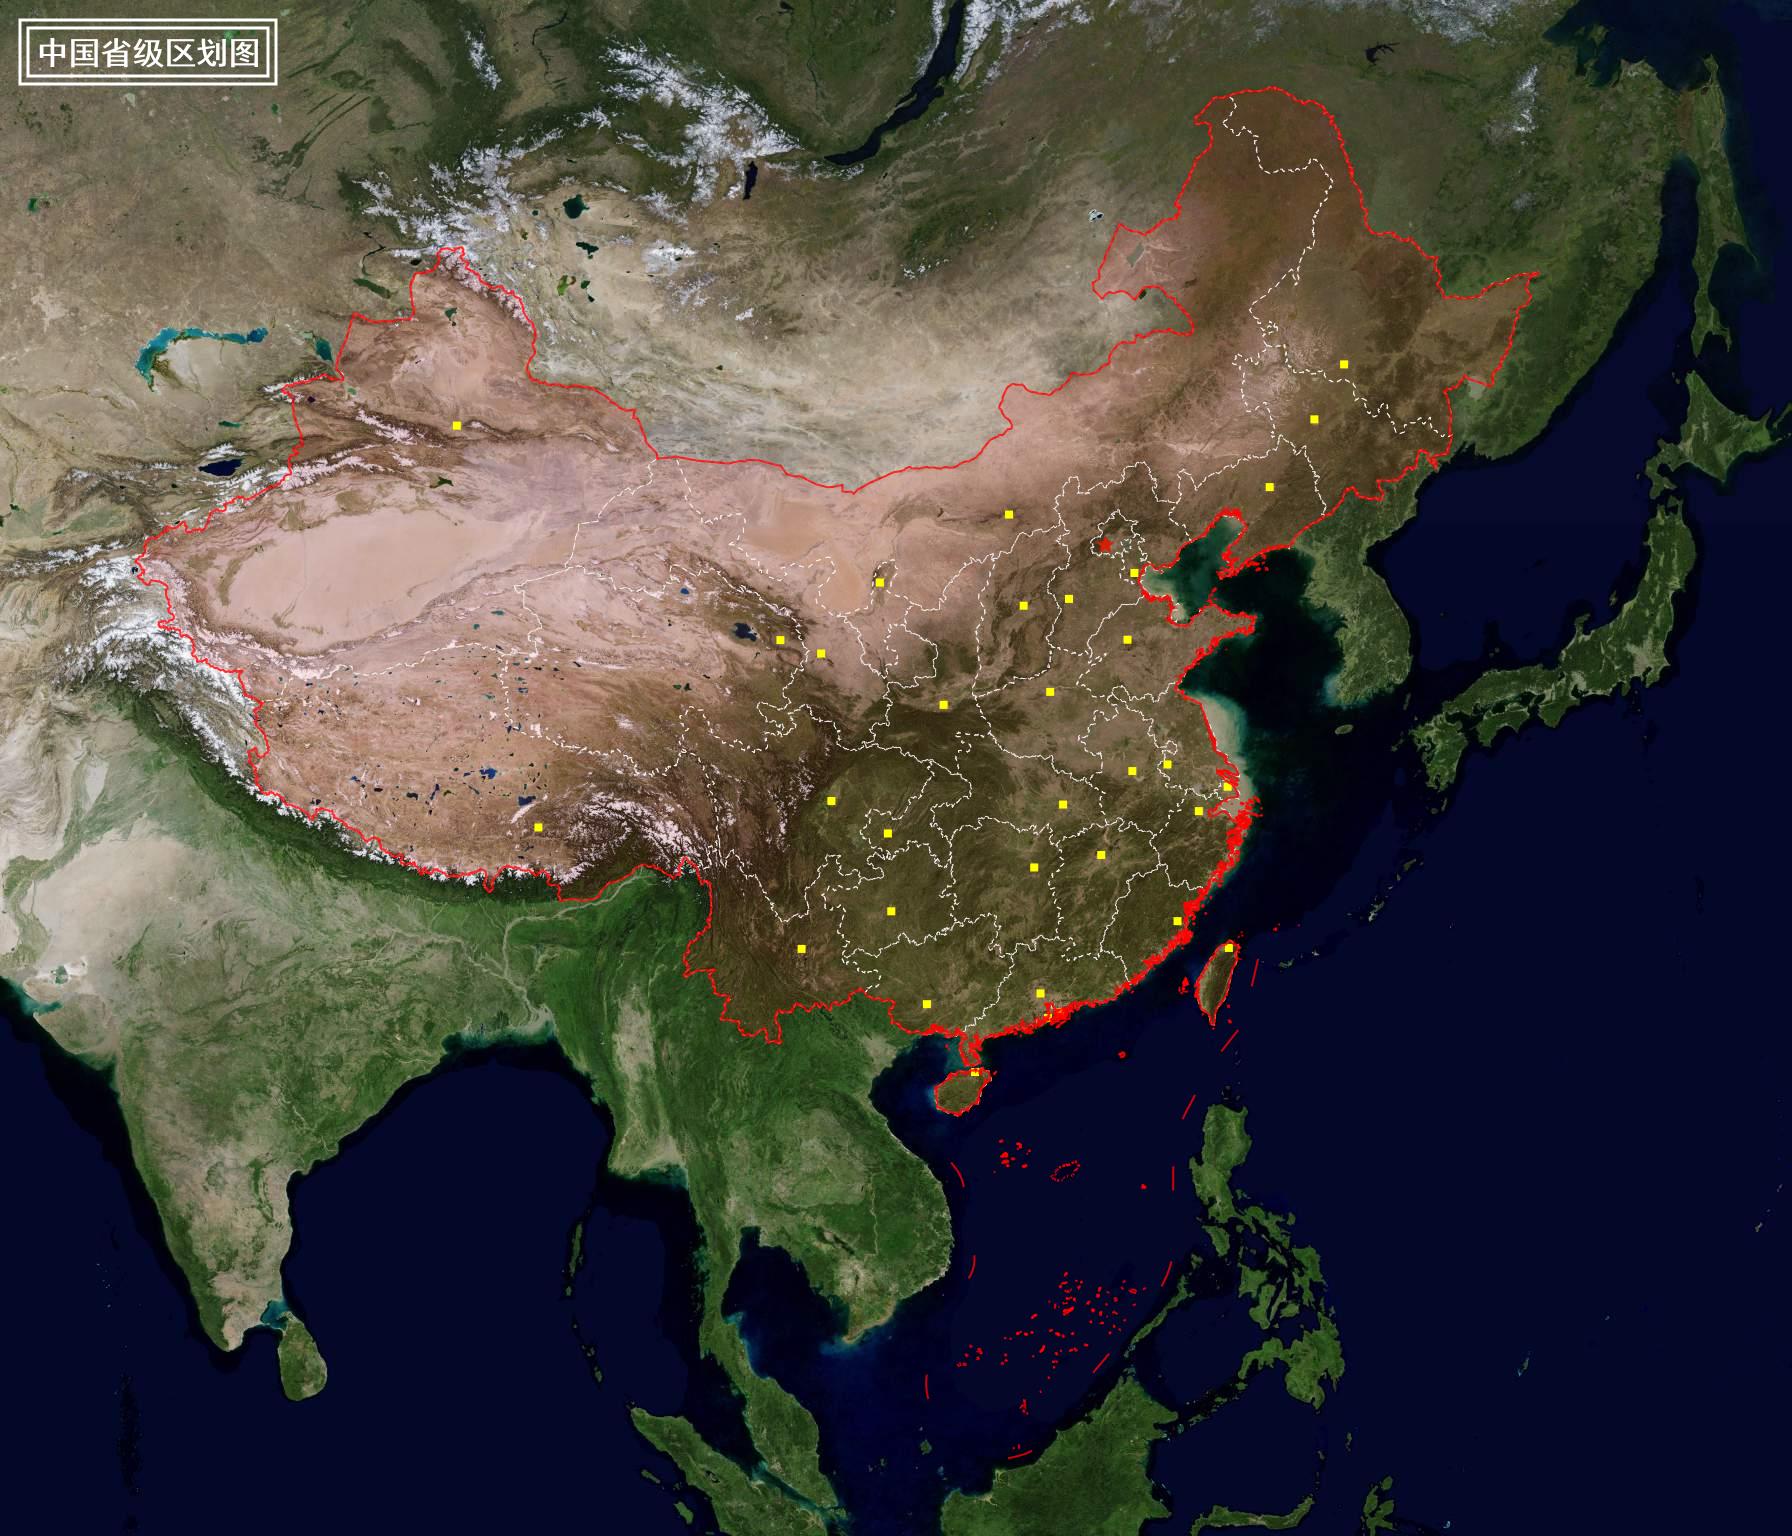
本文讲述在node中,使用canvas实现根据出图范围和级别,拼接瓦片并叠加geojson矢量数据,并导出成图片。
实现效果
实现
1. 初始化工程
通过命令npm init -y初始化工程并添加对应的依赖,最终的package.json文件如下:
  "name": "map",
  "version": "1.0.0",
  "description": "",
  "main": "map.js",
  "scripts":
    "map": "node ./map.js"
  ,
  "keywords": ["canvas", "map"],
  "author": "lzugis<niujp08@qq.com>",
  "license": "ISC",
  "dependencies":
    "canvas": "^2.9.3",
    "proj4": "^2.8.0",
    "ora": "^5.4.0"
2. 编写工具类
canvas.js,canvas操作工具,主要实现canvas画布初始化,并实现了添加图片
、绘制点、绘制线、绘制面等方法。
const  createCanvas, loadImage  = require('canvas')

class CanvasUtil
  constructor(width = 1000, height = 1000)
    this.canvas = createCanvas(width, height)
    this.ctx = this.canvas.getContext('2d')

  /**
   * 绘制多个图片
   * @param imgsData, [url: '', x: '', y: '']
   * @return Promise<unknown>
   */
  drawImages(imgsData)
    const that = this
    let promises = []
    imgsData.forEach(data =>
      promises.push(new Promise(resolve =>
        loadImage(data.url).then(img =>
            resolve(
              ...data,
              img
            )
        )
      ))
    )
    return new Promise(resolve =>
      Promise.all(promises).then(imgDatas =>
        imgDatas.forEach(imgData =>
          that.drawImage(imgData.img, imgData.x, imgData.y)
        )
        resolve(imgDatas)
      )
    )

  /**
   * 绘制一张图片
   * @param image
   * @param x
   * @param y
   * @param width
   * @param height
   */
  drawImage(image, x, y, width, height)
    const that = this
    width = width || image.width
    height = height || image.height
    that.ctx.drawImage(image, x, y, width, height)

  /**
   * 绘制多个点
   * @param pointsData,[type: 'circle', size: 4, x: 100, y: 100, icon: '']
   */
  drawPoints(pointsData = [])
    const that = this
    return new Promise(resolve =>
      let promises = []
      pointsData.forEach(pointData =>
        that.ctx.beginPath()
        that.ctx.save()
        that.ctx.fillStyle = pointData.color || 'rgba(255, 0, 0, 1)'
        const type = pointData.type || 'circle'
        const size = pointData.size || 4
        let x, y = pointData
        pointData.x = x
        pointData.y = y
        switch (type)
          case "rect":
            x -= size
            y -= size
            that.ctx.fillRect(x, y, size * 2, size * 2)
            promises.push(Promise.resolve(pointData))
            break

          case "circle":
            that.ctx.arc(x, y, size, 0, Math.PI * 2)
            that.ctx.fill()
            promises.push(Promise.resolve(pointData))
            break

          case "marker":
            promises.push(new Promise(resolve1 =>
              loadImage(pointData.icon).then(img =>
                const w = img.width * pointData.size
                const h = img.height * pointData.size
                x -= w / 2
                y -= h / 2
                that.drawImage(img, x, y, w, h)
                resolve(pointData)
              )
            ))
            break


        that.ctx.restore()
      )
      Promise.all(promises).then(res =>
        resolve(
          code: '200'
        )
      )
    )

  /**
   * 绘制线
   * @param linesData []
   * @return Promise<unknown>
   */
  drawLines(linesData)
    const that = this
    return new Promise(resolve =>
      linesData.forEach(lineData =>
        that.ctx.beginPath()
        that.ctx.save()
        that.ctx.strokeStyle = lineData.color || 'red'
        that.ctx.lineWidth = lineData.width || 2
        that.ctx.setLineDash(lineData.dasharray || [5, 0]);
        lineData.coords.forEach((coord, index) =>
          const [x, y] = coord
          index === 0 ? that.ctx.moveTo(x, y) : that.ctx.lineTo(x, y)
        )
        that.ctx.stroke()
        that.ctx.restore()
      )
      resolve(
        code: '200'
      )
    )

  /**
   * 绘制多边形
   * @param polygonsData
   * @return Promise<unknown>
   */
  drawPolygons(polygonsData)
    const that = this
    return new Promise(resolve =>
      polygonsData.forEach(polygonData =>
        that.ctx.beginPath()
        that.ctx.save()
        polygonData.coords.forEach((coord, index) =>
          const [x, y] = coord
          index === 0 ? that.ctx.moveTo(x, y) : that.ctx.lineTo(x, y)
        )
        that.ctx.closePath()
        if(polygonData.isFill)
          that.ctx.fillStyle = polygonData.fillStyle || 'rgba(255, 0, 0,  0.2)'
          that.ctx.fill()

        if(polygonData.isStroke)
          that.ctx.strokeStyle = polygonData.strokeStyle || 'red'
          that.ctx.lineWidth =  polygonData.lineWidth || 2
          that.ctx.setLineDash(polygonData.lineDash || [5, 0]);
          that.ctx.stroke()

        that.ctx.restore()
      )
      resolve(
        code: '200'
      )
    )

  /**
   * 获取canvas数据
   * @return string
   */
  getDataUrl()
    return this.canvas.toDataURL().replace(/^data:image\\/\\w+;base64,/, '')

  /**
   * 添加标题
   * @param title
   */
  addTitle(title)
    this.ctx.save()
    this.ctx.strokeStyle = '#fff'
    this.ctx.lineWidth = 3
    this.ctx.fillStyle = '#fff'
    let x = 20, y = 20, offset = 8
    let h = 32
    this.ctx.font = `bold $hpx 微软雅黑`
    this.ctx.textAlign = 'left'
    this.ctx.textBaseline = 'top'
    let w = this.ctx.measureText(title).width
    // 外边框
    this.ctx.strokeRect(x, y, offset * 4 + w, offset * 4 + h)
    // 内边框
    this.ctx.strokeRect(x + offset, y + offset, offset * 2 + w, offset * 2 + h)
    // 文字
    this.ctx.fillText(title, x + offset * 2, y + offset * 2)
    this.ctx.restore()


module.exports = CanvasUtil
tile.js,切片操作工具,提供了坐标转换的方法、获取范围内的切片的行列范围、地理坐标转换为屏幕坐标等方法。
const proj4 = require('proj4')
const  randomNum  = require('./common')
class TileUtil
  constructor(tileSize = 256)
    this.tileSize = tileSize
    this.origin = 20037508.34
    this.resolutions = []
    let resolution = (this.origin * 2) / this.tileSize
    for (let i = 0; i < 23; i++)
      this.resolutions.push(resolution)
      resolution /= 2

    this.tileUrl = 'https://webst0domain.is.autonavi.com/appmaptile?style=6&x=x&y=y&z=z'

  /**
   * 4326转3857
   * @param lonlat
   * @return *
   */
  fromLonLat(lonlat)
    return proj4('EPSG:4326', 'EPSG:3857', lonlat)

  /**
   * 3857转4326
   * @param coords
   * @return *
   */
  toLonLat(coords)
    return proj4('EPSG:3857', 'EPSG:4326', coords)

  /**
   * 获取范围内的切片的行列号的范围
   * @param zoom
   * @param extent
   * @return number[]
   */
  getTilesInExtent(zoom, extent)
    extent = this.getExtent(extent)
    const [xmin, ymin, xmax, ymax] = extent
    const res = this.resolutions[zoom] * 256
    const xOrigin = -this.origin, yOrigin = this.origin
    const _xmin = Math.floor((xmin - xOrigin) / res)
    const _xmax = Math.ceil((xmax - xOrigin) / res)
    const _ymin = Math.floor((yOrigin - ymax) / res)
    const _ymax = Math.ceil((yOrigin - ymin) / res)
    return [_xmin, _ymin, _xmax, _ymax]

  /**
   * 获取切片地址
   * @param x
   * @param y
   * @param z
   * @return string
   */
  getTileUrl(x, y, z)
    let url = this.tileUrl.replace(/\\x\\/g, x)
    url = url.replace(/\\y\\/g, y)
    url = url.replace(/\\z\\/g, z)
    return url.replace(/\\domain\\/g, randomNum())

  /**
   * 获取切片大小
   * @return number
   */
  getTileSize()
    return this.tileSize

  /**
   * 地理坐标转换为屏幕坐标
   * @param extent
   * @param zoom
   * @param lonLat
   * @return *[]
   */
  project(extent, zoom, lonLat)
    const [xmin, ymin, xmax, ymax] = this.getTilesInExtent(zoom, extent)
    const res = this.resolutions[zoom]
    const resMap = this.tileSize * res
    const topLeft = [
      resMap * xmin - this.origin,
      this.origin - resMap * ymin
    ]
    const coords = this.fromLonLat(lonLat)
    const x = (coords[0] - topLeft[0]) / res
    const y = (topLeft[1] - coords[1]) / res
    return [x, y]

  /**
   * 处理四至
   * @param extent
   * @return *[]
   */
  getExtent(extent)
    if(Boolean(extent))
      const min = this.fromLonLat([extent[0], extent[1]])
      const max = this.fromLonLat([extent[2], extent[3]])
      extent = [...min, ...max]
     else
      extent = [-this.origin, -this.origin, this.origin, this.origin]

    return extent


  /**
   * 判断是否在范围内
   * @param extent
   * @param lonLat
   * @return boolean
   */
  isInExtent(extent, lonLat)
    const [xmin, ymin, xmax, ymax] = extent
    const [lon, lat] = lonLat
    return lon >= xmin && lon <= xmax && lat >=ymin && lat <= ymax


module.exports = TileUtil
map.js,实现地图导出,会用到前面提到的两个工具类。
const fs = require('fs');
const ora = require('ora'); // loading
const TileUtil = require('./utils/tile')
const CanvasUtil = require('./utils/canvas')

const spinner = ora('tile joint').start()
const tileUtil = new TileUtil()
const z = 5
// const extent = undefined
const extent = [73.4469604492187500,6.3186411857604980,135.0858306884765625,53.5579261779785156]
const [xmin, ymin, xmax, ymax] = tileUtil.getTilesInExtent(z, extent)
const width = (xmax - xmin) * tileUtil.getTileSize()
const height = (ymax - ymin) * tileUtil.getTileSize()
const canvasUtil = new CanvasUtil(width, height)
let urls = []
for(let i = xmin; i < xmax; i++)
  const x = (i - xmin) * tileUtil.getTileSize()
  for(let j = ymin以上是关于Node实现切片的拼接和地图的导出的主要内容,如果未能解决你的问题,请参考以下文章