吴恩达_MIT_MachineLearning公开课ch03
Posted 给个HK.phd读
tags:
篇首语:本文由小常识网(cha138.com)小编为大家整理,主要介绍了吴恩达_MIT_MachineLearning公开课ch03相关的知识,希望对你有一定的参考价值。
回顾逻辑回归
逻辑回归常用于分类问题。里面常用到的一系列公式函数不能忘记。
比如:
交叉熵损失函数用于度量当前拟合系数theta的损失值、
Sigmoid激活函数,用于将值压缩至(0,1)区间内作为概率处理、
为损失函数以及对应的求导公式加上一个惩罚项等。
但我们上一轮做的是二分类问题,就是问题只有两种解,今天是一对多问题。
多元分类
也称一对多分类。
就是有好几类等待我们进行划分,我们的策略是:
将某一类的标签置为1,另外所有的标签置为0训练出一个二分类“分类器”。
说白了就是一组系数,这组系数可以求解出我属于这一类的概率。
因此我们比如有K类,我们就是做一个循环,训练出K个分类器用于求各自类的概率即可。总体来说这还是线性分类器。
手写数字分类
Minist是一个开源手写数字数据集。
其中包含了[0, 9],共10类,这里比较诡异的就是把0的类别归为10了!
1.读取数据并展示。
这里作业里头文件给到的是.mat格式,于是要利用scipy的一个函数来读取,读完后返回的是一个dict格式的python数据。按需取出我们的数据即可。
还有一点值得注意的是我把0的标签由默认的10改为0了,会好操作很多。
返回后应该发现X是一个[5000, 400]的array,有5000条数据,每一条数据其实是一个灰度图,灰度图大小是20 × 20的,只不过进行了操作变成400了。
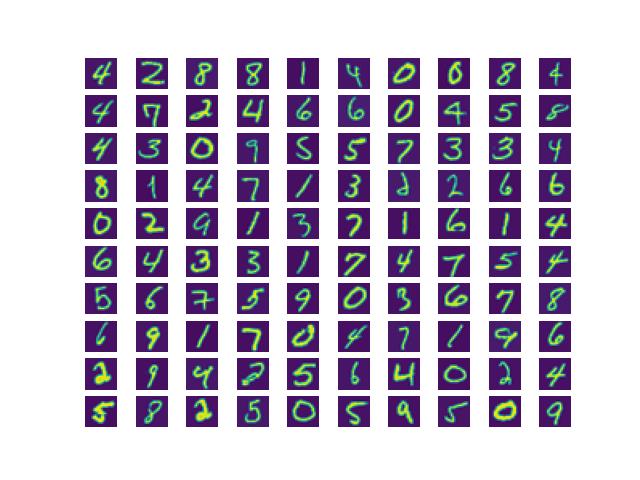
可视化步骤的话我们随机选取100个序号,画100张子图,我们要将其重新恢复到20×20的。(经测试需要进行矩阵转置图片才是正常显示的,否则是旋转90度的!)
def read_mat_file():
    data = loadmat("./ex3data1.mat")  # after debugging, it's a dict
    # one attribution is Y while another is X, it corresponds to the data we read in a cvs format file
    labels = data['y'].reshape(-1)
    # as the initial design, the label of 0 is 10, it's hard to use in practice, so I directly change it to 0
    for i in range(len(labels)):
        if labels[i] == 10:
            labels[i] = 0

    factors = data['X']   # after debugging the dimension of the matrix is [5000, 400]
    # actually, it means we have 5000 grayscale images while the size of an image is [20, 20]
    # but the dataset builder convert an image to an flatten vector, thus, ...
    return factors, labels


def visualize_data(X, Y):
    # X is the (5000, 400) matrix we've extracted
    # therefore, the important thing we should do is to recover the image
    index = np.random.randint(0, len(X) - 1, 100)
    # plt.subplots_adjust(wspace=0, hspace=0)  # 调整子图间距
    for i in range(100):
        plt.subplot(10, 10, i + 1)
        # plt.title(Y[index[i]][0])  # 可以查看对应标签,但在此图中应用效果较差.
        # 如果真要显示标签的话可以扩大子图的hspace即上下间距,控制title的字体,调整至最佳效果!
        plt.axis(False)  # 关闭坐标轴
        plt.imshow(np.transpose(X[index[i], :].reshape(20, 20)))
    plt.show()
可视化结果如下所示:

2.训练10个分类器!
训练一个二分类是简单的,ch02已经比较详细的说过了!
10个的话无非就是写个循环,把每个分类器的系数储存到一个矩阵中呗!
写复习训练一个分类器的代码:
我们在其中加入了惩罚项防止过拟合的产生!
# the following code is just as same as what we have implemented in ch02


def sigmoid(X):
    return 1 / (1 + np.exp(-X))  # 激活函数,也是逻辑回归的常用函数


def costFunc(theta, X, Y, lam):
    temp = sigmoid(np.dot(X, theta))
    loss = -np.mean(Y * np.log(temp) + (1 - Y) * np.log(1 - temp))
    reg = np.dot(theta[1:], theta[1:]) * lam / (2 * len(X))
    loss += reg
    return loss


def Gradient(theta, X, Y, lam):
    loss = sigmoid(np.dot(X, theta)) - Y
    grad = np.dot(loss.T, X) / len(X)
    grad[1:] += lam * theta[1:] / len(X)
    return grad


def min_func(theta, X, Y, lam):
    result = opt.minimize(fun=costFunc, args=(X, Y,lam), jac=Gradient, x0=theta, method='TNC')
    return result.x  # after finishing homeworkII you should be clear attribution x is the best theta
那么训练10个,我写的是如下的样例:
我们的大矩阵存放theta系数,应该是(10, X.shape[1])的,10行代表了10类,每一行是训练一个类别得到的系数。
我们在训练二分类的时候,theta就是一个np.zeros(X.shape[1])的向量而已!
也就是我们在循环中写的那个,现在无非是10个叠加起来罢了。
有一点需要注意的是我在里面用了copy,因为直接temp = Y的话两者指向同一内存,对temp进行修改会直接影响Y,那么势必影响后续结果!
按照我们的思路我们就是把属于当前类别的标签置1,其余的均为0,退化为二分类问题,每每训练出一个分类器,将其存放进大矩阵即可!
def One_vs_all_Classification(X, Y, K):
    length = len(X)
    lam = 1
    bias = np.ones((len(X), 1))
    X = np.hstack((bias, X))
    Theta_Matrix = np.zeros((K, X.shape[1]))
    # each row of this huge matrix is the theta parameter of one class
    for i in range(K):
        theta = np.zeros(X.shape[1])
        temp = Y.copy()
        # firstly, the labels should be 0 or 1, only in this way can we deal with a classical
        # binary classification problem
        for j in range(len(temp)):
            if temp[j] == i:
                temp[j] = 1
            else:
                temp[j] = 0
        Theta_Matrix[i, :] = min_func(theta, X, temp, lam)
        # the above Matrix is the learnt result!
    return Theta_Matrix
3.测试预测效果,直接拿原数据集X测试,没有专门设置测试集 (防止一些AI玩多的人来杠) 。
步骤还是类似的,用那个大矩阵乘上加了一列偏置项的X并激活,那么我们应该会得到[5000, 10]的答案!每一行仍旧是一个样本,但每一列就是说某一样本属于那一个类的可能性!
用argmax配合axis参数帮助我们从每一行取出可能性最大的类别号[注意是直接取出类别号而不是概率值哦],就能得到[5000, 1]的值,这就是我们的预测结果,每一行代表案例,一列就是预测的其对应的类别。
求它和Y真实标签本身的相同个数,求出准确率。
def Prediction(Theta, X, Y):
    Bias = np.ones((len(X), 1))
    X = np.hstack((Bias, X))
    Results = sigmoid(np.dot(X, Theta.T))
    # 对了!!  在Classification主函数中 temp必须要用Y的copy来赋值!! 否则因为传递的是指针,会直接修改Y本身,就出问题了!!

    # OK the size of Results matrix is (5000, 11)
    # 5000 means we have 5k examples while 11 means the probability that the image is current category
    # next thing we should do is to calculate the accuracy of the prediction

    # first we extract a (5000, ) vector from the Results matrix!
    answers = np.argmax(Results, axis=1)  # axis 1 means we always select the max probability by row!!
    # the function will automatically find the correspond index for you!

    # then the final thing we should do is to compare the predictions and real labels!!
    num = np.sum(answers == Y)
    accuracy = np.sum(answers == Y) / len(Y)
    print("accuracy is %f" % accuracy)
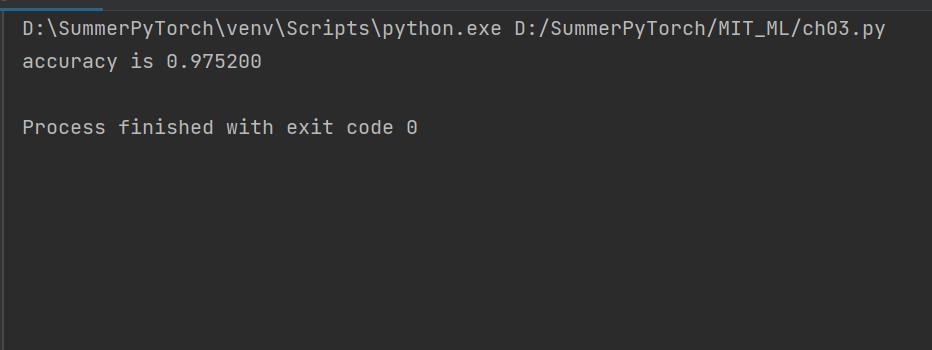
这是我的结果:

神经网络
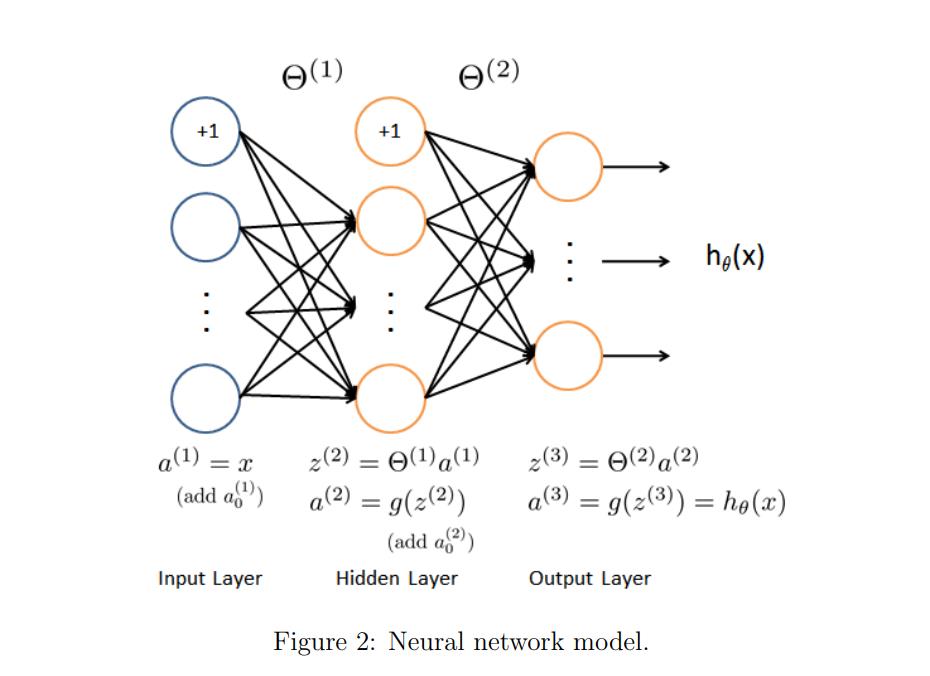
这个模型就是本次作业要实现的前向传播的模型。
我们把第一层和最后一层分别称为输入和输出层,中间层叫做隐藏层。
每一个结点我们叫做神经元,每一层都会有自己的一个theta权重矩阵。
比如输入层是一个X,其会有自己的theta1,矩阵运算并激活后得到result1也就是第一个隐藏层的输入。隐藏层又会有自己的theta2,重复上述运算直到最后的输出层…输出有几类最后的矩阵就应该有几列。
神经网络的好处就是可以让隐藏层训练自己想训练的参数,因为不难发现后续的隐藏层不再是拟合一开始输入的X了而是别的隐藏层输出的结果了,从而起到非线性的作用,得到更棒的拟合效果!

实现前向传播并预测手写数字分类
1.读取数据
这里处理标签方式不大一样,是为每种标签做减一处理。。
def read_file_for_nn():
    # for neural networks all the label reduced by 1. like label of 0 is 9 and label of 1 is 0
    data = loadmat("./ex3data1.mat")
    labels = data['y'].reshape(-1)
    labels = labels - 1
    factors = data['X']
    return factors, labels
2.实现前向传播。
实际上也是矩阵运算,加一列偏置项和运用激活函数Sigmoid罢了。
其中神经网络的每一层的权重theta已经在文件中给出了,直接取出来调用即可。
temp1就是输入层+一列偏置项和对应的theta1相乘的结果。
results就是temp1+一列偏置项和对应的theta2相乘的结果。
预测过程和上面的是一样的。
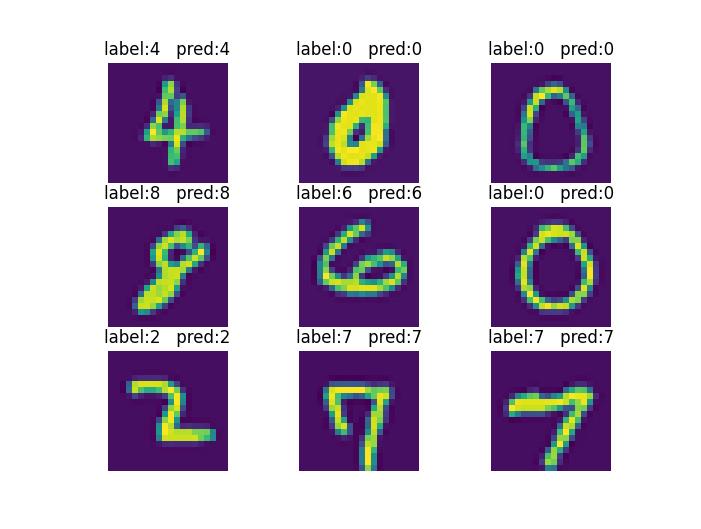
最后就是将预测和实际标签可视化出来,做了一个小处理就是加一后标签如果是10就显示为0,其余的补上1即可。(因为我们在读取数据的时候为所有标签减了1)
def Neural_Networks(X, Y):
    images = X.copy()
    parameters = loadmat("./ex3weights.mat")
    # extract the learnt parameters!
    theta1 = parameters['Theta1']
    theta2 = parameters['Theta2']
    # add a column ans use matrix multiplication
    bias = np.ones((X.shape[0], 1))
    X = np.hstack((bias, X))
    temp1 = sigmoid(np.dot(X, theta1.T))
    bias2 = np.ones((temp1.shape[0], 1))
    temp1 = np.hstack((bias2, temp1))
    results = sigmoid(np.dot(temp1, theta2.T))
    # extract the max probability from a row
    ans = np.argmax(results, axis=1)
    accuracy = np.sum(ans == Y) / X.shape[0]
    # calculate accuracy
    print("accuracy is %f" % accuracy)

    # at last, we can just visualize the prediction
    show_index = np.random.randint(0, len(X), 9)
    for i in range(9):
        plt.subplot(3, 3, i + 1)
        plt.axis(False)
        plt.imshow(np.transpose(images[show_index[i], :].reshape(20, 20)))
        # because when we read file, real label subtracts 1, thus, we add 1 to corresponds to the image
        # don't forget that the label of 0 is 10!!!
        # by the way, we can learn the ternary operator in Python, it's just a little bit different than C++ or C
        l1 = Y[show_index[i]] + 1 if Y[show_index[i]] + 1 < 10 else 0
        l2 = ans[show_index[i]] + 1 if ans[show_index[i]] + 1 < 10 else 0
        plt.title("label:%d   pred:%d" % (l1, l2))
    plt.show()
结果显示:
显然准确率比一对多线性分类器来得高!

这里运气很好,刚好没遇到有差错的!

总结
神经网络难点不在前向传播。。。
主要后面在学反向传播的时候得认认真真(back propagation)
一对多分类问题我们就退化成K个二分类问题即可,K就是要分辨出的类别数。
最后,finally

以上是关于吴恩达_MIT_MachineLearning公开课ch03的主要内容,如果未能解决你的问题,请参考以下文章