Go使用gopsutil 和 go-echarts 生成系统状态图表
Posted Harris-H
tags:
篇首语:本文由小常识网(cha138.com)小编为大家整理,主要介绍了Go使用gopsutil 和 go-echarts 生成系统状态图表相关的知识,希望对你有一定的参考价值。
Go使用gopsutil 和 go-echarts 生成系统状态图表
1.结构
1.使用gopsutil获取数据
2.使用go-echarts生成图表
2.细节
- 生成数据是生成一组(key,val) 就是x轴和y轴对应的数据。
- 日期格式化:
time.Now().Format("15:04:05")这里是只包含时分秒。 - 浮点数格式化小数点后两位,
strconv.FormatFloat(totalPercent[0], 'f', 2, 64) - 配置图表的一些参数可以参考drawLineChart()函数里的配置。
3.代码
package main
import (
"fmt"
"github.com/go-echarts/go-echarts/v2/charts"
"github.com/go-echarts/go-echarts/v2/opts"
"github.com/shirou/gopsutil/v3/cpu"
"os"
"strconv"
"time"
// "github.com/shirou/gopsutil/mem" // to use v2
)
// cpu info
func getCpuInfo()
cpuInfos, err := cpu.Info()
if err != nil
fmt.Printf("get cpu info failed, err:%v", err)
for _, ci := range cpuInfos
fmt.Println(ci)
// CPU使用率
for
percent, _ := cpu.Percent(time.Second, false)
fmt.Printf("cpu percent:%v\\n", percent)
// generate random data for line chart
func generateVMItems(cnt int) ([]string, []opts.LineData)
keys := make([]string, 0)
vals := make([]opts.LineData, 0)
for i := 0; i < cnt; i++
keys = append(keys, time.Now().Format("15:04:05"))
totalPercent, _ := cpu.Percent(5*time.Second, false) //从当前时刻开始5s的cpu使用率
tmp := strconv.FormatFloat(totalPercent[0], 'f', 2, 64)
vals = append(vals, opts.LineDataValue: tmp)
return keys, vals
func drawLineChart()
// create a new line instance
line := charts.NewLine()
line.SetGlobalOptions(
charts.WithTitleOpts(opts.Title //标题
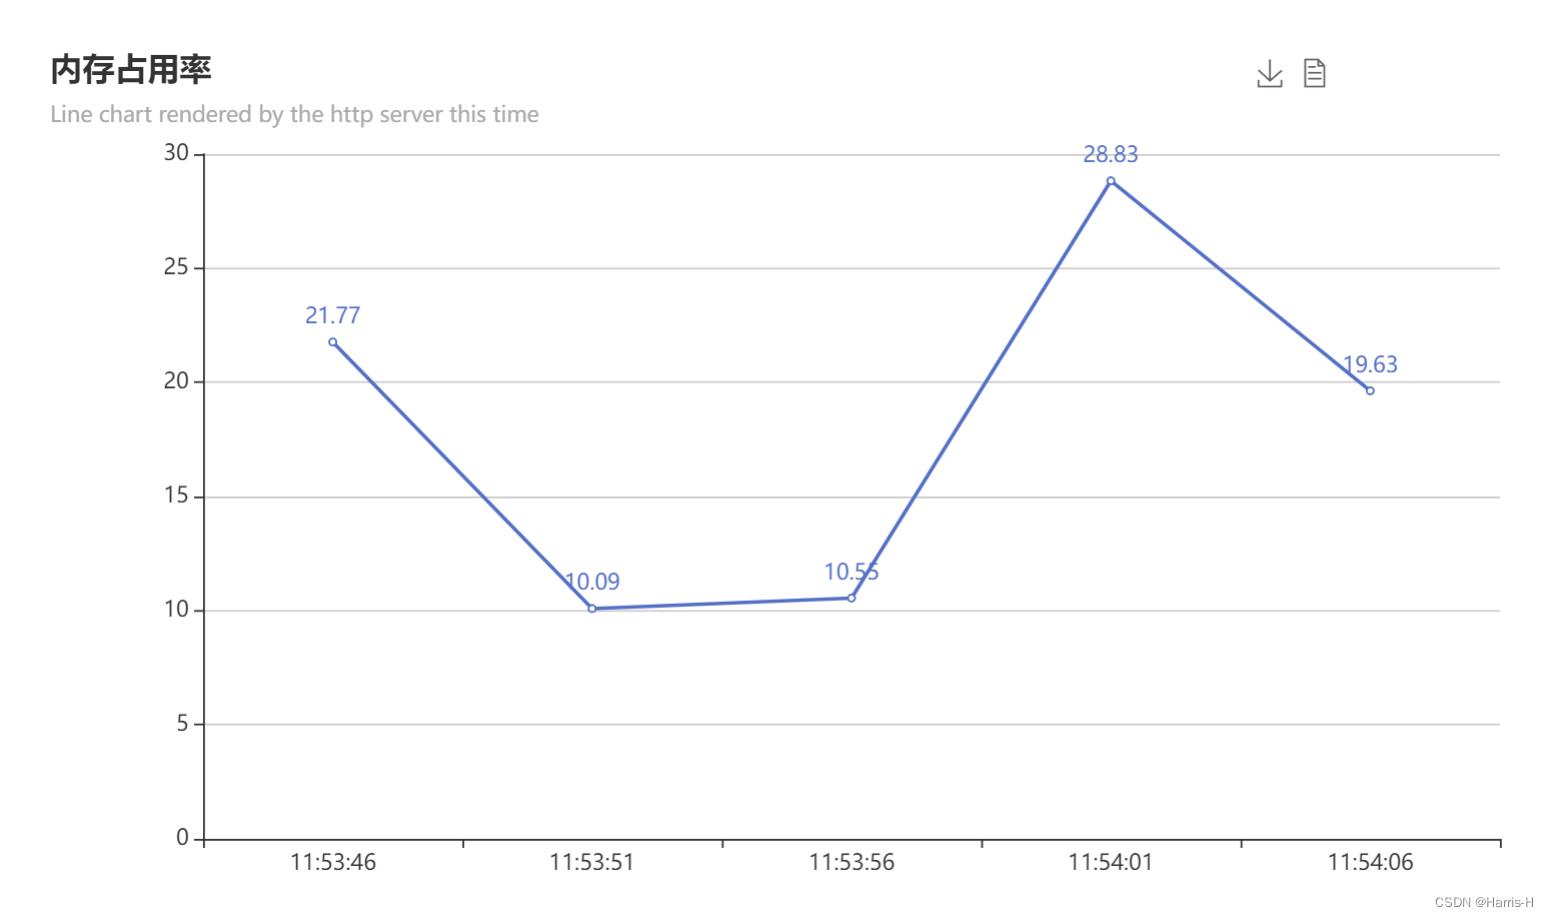
Title: "内存占用率",
Subtitle: "Line chart rendered by the http server this time",
),
charts.WithTooltipOpts(opts.TooltipShow: true),
charts.WithToolboxOpts(opts.Toolbox //工具盒配置
Show: true,
Right: "20%",
Feature: &opts.ToolBoxFeature
SaveAsImage: &opts.ToolBoxFeatureSaveAsImage
Show: true,
Type: "png",
Title: "Anything you want",
,
DataView: &opts.ToolBoxFeatureDataView
Show: true,
Title: "DataView",
// set the language
// English version: "data view", "turn off", "refresh",
Lang: []string"数据视图", "关闭", "刷新",
,
,
))
k, v := generateVMItems(5)
// Put data into instance
line.SetXAxis(k).AddSeries("Server 1", v).SetSeriesOptions(
charts.WithLabelOpts(opts.Label //显示数据
Show: true,
Position: "top",
),
)
f, _ := os.Create("line.html")
err := line.Render(f)
if err != nil
return
func main()
//getCpuInfo()
drawLineChart()
4.结果
5.总结
本文通过后端获取数据并生成图表,实际上生成图表的工作应该交给前端渲染数据生成。所以本文的下一个方向就是Vue+Go生成图表。
以上是关于Go使用gopsutil 和 go-echarts 生成系统状态图表的主要内容,如果未能解决你的问题,请参考以下文章