G2plot图表在Vue中使用-获取新数据后二次渲染图表-案例
Posted JackieDYH
tags:
篇首语:本文由小常识网(cha138.com)小编为大家整理,主要介绍了G2plot图表在Vue中使用-获取新数据后二次渲染图表-案例相关的知识,希望对你有一定的参考价值。
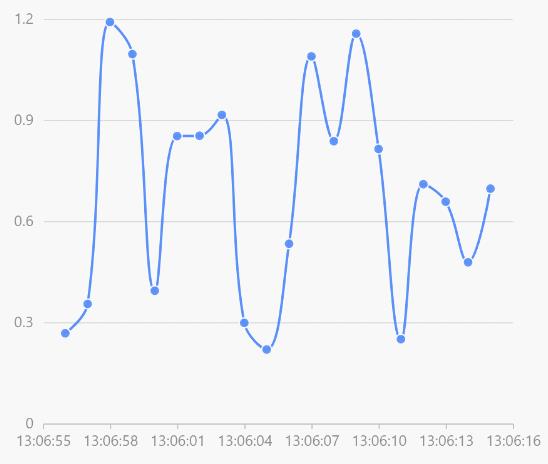
效果
示例代码-api介绍
import  Line  from '@antv/g2plot';

function getData()
  // generate an array of random data
  const data = [];
  const time = new Date().getTime();

  for (let i = -19; i <= 0; i += 1)
    data.push(
      x: time + i * 1000,
      y: Math.random() + 0.2,
    );

  return data;


const line = new Line('container',
  data: getData(),
  padding: 'auto',
  xField: 'x',
  yField: 'y',
  xAxis:
    type: 'time',
    mask: 'HH:MM:ss',
  ,
  smooth: true,
  point: ,
);

line.render();

setInterval(() =>
  const x = new Date().getTime(), // current time
    y = Math.random() + 0.2;
  const newData = line.options.data.slice(1).concat( x, y );
  line.changeData(newData);
, 1000);
Vue组件方式
组件
<template>
  <div id="Histogram" ref="Histogram" :style="getHeight()"></div>
</template>

<script>
import  Column  from '@antv/g2plot'
let chartChange
export default
  props:
    value:
      type: Array,
      default()
        return []
      ,
    ,
    Height:
      type: Number,
      default: 0,
    ,
  ,
  data()
    return
      radarPlot: null,

  ,
  // 监听
  watch:
    value:
      handler(newVal, oldVal)
        console.log(newVal)
		// 方式一 有新数据从新渲染图表
        chartChange.changeData(newVal)
		// 方式二 先销毁图表 在创建图表
        // chartChange.destroy()
        // this.initRadarPlot()
      ,
      deep: true, //深度监听
      // immediate: true,
    ,
  ,
  mounted()
    this.initRadarPlot()
  ,
  methods:
    initRadarPlot()
	  // 使用ref的方式组件可以多次使用
      // const chartChange = new Column(this.$refs.Histogram,
      chartChange = new Column(this.$refs.Histogram,
        data: this.value,
        height: this.Height,
        xField: 'label',
        yField: 'amount',
        label:
          // 可手动配置 label 数据标签位置
          position: 'top', // 'top', 'middle', 'bottom'
          // 可配置附加的布局方法
          layout: [
            // 柱形图数据标签位置自动调整
             type: 'interval-adjust-position' ,
            // 数据标签防遮挡
             type: 'interval-hide-overlap' ,
            // 数据标签文颜色自动调整
             type: 'adjust-color' ,
          ],
          content: (originData) =>
            return originData.amount + '%'
          ,
          style:
            fill: '#000',
          ,
        ,
        tooltip:
          formatter: (originData) =>
            return  name: '占比', value: originData.amount + '%'
          ,
        ,
        xAxis:
          //   title:
          //     //title:null 不显示title
          //     style:
          //       fontSize: 14,
          //       fill: 'red', // 文本颜色
          //     ,
          //   ,
          label:
            // style:
            //   fill: 'green',
            // ,
            autoHide: true,
            autoRotate: false,
          ,
        ,
        yAxis:
          min: 0,
          // max: 20,
          //   title:
          //     //title:null 不显示title
          //     style:
          //       fontSize: 14,
          //       fill: 'red', // 文本颜色
          //     ,
          //   ,
          label:
            // formatter: (originData) => `$originData%`,
            // style:
            //   fill: 'green',
            // ,
            autoHide: true,
            autoRotate: false,
          ,
          // line:
          //   style:
          //     stroke: 'red',
          //   ,
          // ,
        ,
        meta:
          label:
            alias: '销售额趋势',
          ,
          amount:
            alias: '占比',
          ,
        ,
        // legend:
        //   // layout: 'horizontal',
        //   position: 'right',
        // ,
      )
      chartChange.render()
    ,
    // 图表高度
    getHeight()
      let height = parseInt(this.Height)
      return  height: height + 'px'
    ,
  ,

</script>

<style>
</style>
不要将chart实例化在初始化方法里,将这个实例保存下来
重载方法不要去new Chart
使用
<template>
	<Histogram :value="HistogramData" :Height="350" />
</template>
<script>
import  Histogram  from '@/components'
export default
  name: 'WorkBench',
  components: Histogram,
  data()
    return
	HistogramData: [
        [

            label: '2022-06',
            amount: 17,
          ,

            label: '2022-05',
            amount: 12,
          ,

            label: '2022-04',
            amount: 40,
          ,

            label: '2022-03',
            amount: 1,
          ,

            label: '2022-02',
            amount: 10,
          ,
        ],
      ],


</script>
以上是关于G2plot图表在Vue中使用-获取新数据后二次渲染图表-案例的主要内容,如果未能解决你的问题,请参考以下文章