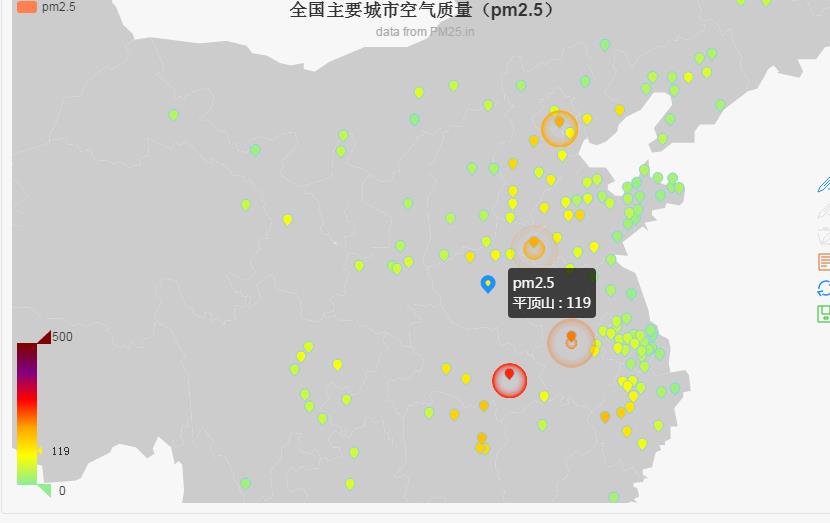
e_charts如何添加地图markPoint的点击事件?????比如我要点击下图中的那个点并且出现浮动框
Posted
tags:
篇首语:本文由小常识网(cha138.com)小编为大家整理,主要介绍了e_charts如何添加地图markPoint的点击事件?????比如我要点击下图中的那个点并且出现浮动框相关的知识,希望对你有一定的参考价值。
是点击后弹出新窗口,不是地图上那个标签框,那个原本就有的

API上不是有吗?
option=title:
text:'山东省事业费开支情况',
textStyle:fontSize: 20,fontWeight:'bolder',color:'#333',
x:'center'
,
tooltip:
trigger:'item'
,
legend:
orient:'vertical',
x:'left',
data: ['开支比例']
,
dataRange:
min: 0,
max: 1000,
color:['orange','yellow'],
text:['高','低'],
x:'right',
y:'bottom',
calculable : true
,
series: [
name:'开支比例',
type:'map',
mapType:'山东',
selectedMode: 'single',
itemStyle:
normal: label: show:true ,color:'black' ,
emphasis: label: show:true
,
mapLocation:x:'center',y:'center',
mapValuePrecision:2,
roam:false,
data: [
name: "烟台市",value: Math.round(Math.random()*1000),
name: "临沂市",value: Math.round(Math.random()*1000),
name: "潍坊市",value: Math.round(Math.random()*1000),
name: "青岛市",value: Math.round(Math.random()*1000),
name: "菏泽市",value: Math.round(Math.random()*1000),
name: "济宁市",value: Math.round(Math.random()*1000),
name: "德州市",value: Math.round(Math.random()*1000),
name: "滨州市",value: Math.round(Math.random()*1000),
name: '聊城市',value: Math.round(Math.random()*1000),
name: "东营市",value: Math.round(Math.random()*1000),
name: "济南市",value: Math.round(Math.random()*1000),
name: "泰安市",value: Math.round(Math.random()*1000),
name: "威海市",value: Math.round(Math.random()*1000),
name: "日照市",value: Math.round(Math.random()*1000),
name: "淄博市",value: Math.round(Math.random()*1000),
name: "枣庄市",value: Math.round(Math.random()*1000),
name: "莱芜市",value: Math.round(Math.random()*1000)
],
geoCoord:
"烟台":[120.78,37.63],
"潍坊":[119.14,36.64],
"临沂":[118.35,35.40],
"青岛":[120.50,36.45],
"济南":[117.20,36.98],
"莱芜":[117.70,36.38],
"滨州":[117.87,37.60],
"聊城":[115.96,36.51],
"日照":[119.32,35.61],
"泰安":[117.07,36.16],
"济宁":[116.88,35.45],
"枣庄":[117.36,35.00],
"淄博":[118.08,36.72],
"德州":[116.73,37.32],
"威海":[122.00,37.25],
"东营":[118.75,37.67],
"菏泽":[115.66,35.32]
,
name: '存在超支项目',
type: 'map',
mapType: '山东',
data:[],
markPoint :
symbol:'star',
symbolSize : 10,
effect :
show: true,
color:'red',
shadowColor:'red',
//period: 10,
shadowBlur : 0
,
itemStyle:
normal:
label:show:false
,
data : [
name: "菏泽", value:500
]
]
;
var ecConfig = require('echarts/config');
myChart.on(ecConfig.EVENT.CLICK, eConsole);
function eConsole(param)
alert(1111);
alert(param.name);
参考技术A var charts = echarts.init(document.getElementById(id));
charts.setOption(option);
charts .on('click', function (params)
if(params.componentType == "markPoint")
console.log(params);
);
API ->events有对params的介绍
以上是关于e_charts如何添加地图markPoint的点击事件?????比如我要点击下图中的那个点并且出现浮动框的主要内容,如果未能解决你的问题,请参考以下文章