Python 绘制误码率对比折线图,纵坐标是10次幂,即求对数
Posted Better Bench
tags:
篇首语:本文由小常识网(cha138.com)小编为大家整理,主要介绍了Python 绘制误码率对比折线图,纵坐标是10次幂,即求对数相关的知识,希望对你有一定的参考价值。
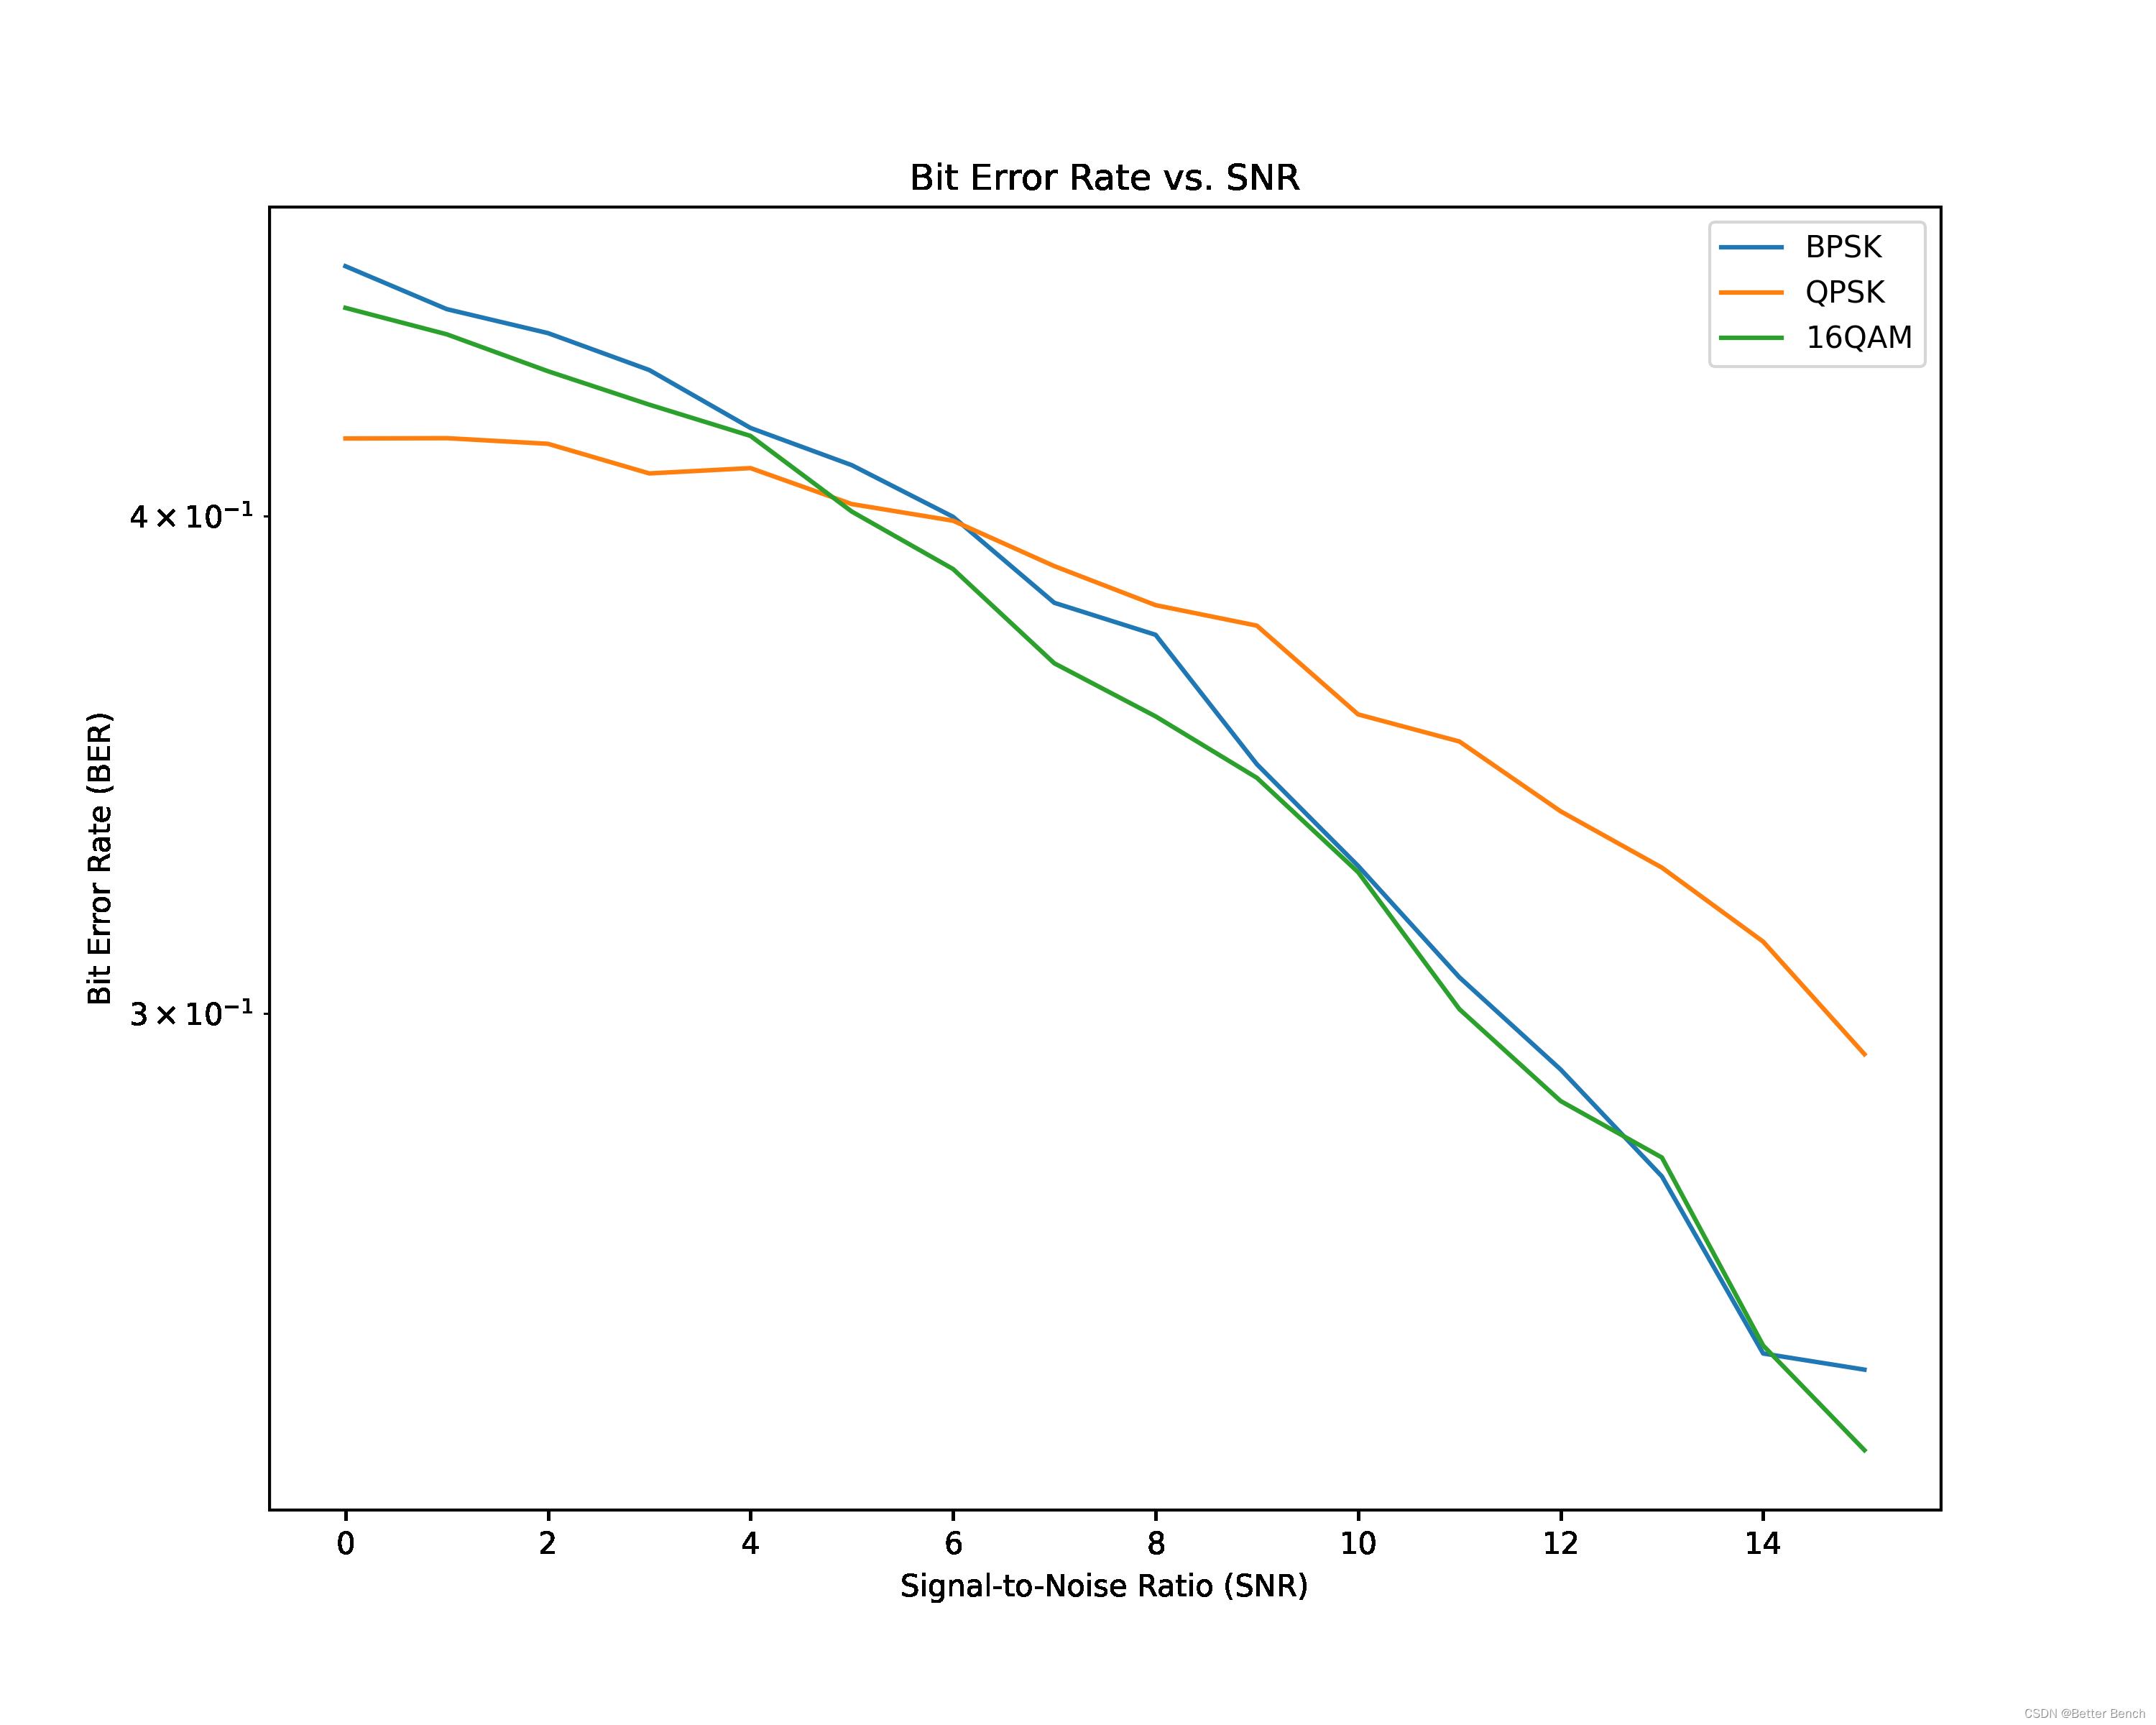
在通信中,需要对比解调的精度,纵坐标是误码率,且单位是10次幂,即对数显示,横坐标是信噪比,可视化程序如下
import numpy as np
import matplotlib.pyplot as plt

def draw_ber_line_graph(ber_list,labels,img_name):
    """
    Draws a line graph of the bit error rate (BER) of three different signals
    over a range of signal-to-noise ratios (SNRs).

    Parameters:
    -----------
    ber_list : list
       多个误码率列表
    labels : list
        每个误码率列表的名称
    img_name : str
        保存图片的名字
    """
    # Define the SNR range
    snr_range = np.arange(0, 16)
    # Convert the BER lists to arrays
    i = 0
    fig, ax = plt.subplots(figsize=(10,8))
    for ber in ber_list:
        ber1 = np.array(ber)
        # Convert the y-coordinate to the power of 10
#         ber1 = np.power(10, ber1)
        # Create a new figure and axis object
        # Plot the BER lines
        ax.semilogy(snr_range, ber1, label=labels[i])
        i+=1
    # Add axis labels and title
    plt.yscale('log')
    ax.set_xlabel('Signal-to-Noise Ratio (SNR)')
    ax.set_ylabel('Bit Error Rate (BER)')
    ax.set_title('Bit Error Rate vs. SNR')

    # Add a legend
    ax.legend()
    plt.savefig(f'img/img_name.png',dpi=300)
    # Show the plot
    plt.show()
使用例子
y_b = [0.4620078125, 0.45069531249999994, 0.44449218749999997, 0.43511718749999995, 0.42079687499999996, 0.4118515625, 0.39975000000000005, 0.380375, 0.37340625000000005, 0.346515625, 0.32675, 0.306390625, 0.29049218750000005, 0.27310156249999995, 0.24654687500000005, 0.2442578125]
y_q = [0.41825, 0.4183203125, 0.4169609375, 0.409890625, 0.4111484375, 0.4026953125, 0.39884375, 0.3885234375, 0.379859375, 0.375390625, 0.3566328125, 0.35109375, 0.3372109375, 0.326421875, 0.3127578125, 0.293078125]
y_m = [0.4510234375, 0.4441875, 0.4348125, 0.4265, 0.4188671875, 0.4009609375, 0.387875, 0.3673125, 0.3562265625, 0.3438046875, 0.3255703125, 0.3008046875, 0.28525, 0.27609375, 0.2476796875, 0.23315625]

draw_ber_line_graph([y_b,y_q,y_m],['BPSK','QPSK','16QAM'],'不同的调制方式')
以上是关于Python 绘制误码率对比折线图,纵坐标是10次幂,即求对数的主要内容,如果未能解决你的问题,请参考以下文章