Beats:使用 fingerprint 来连接 Beats/Logstash 和 Elasticsearch
Posted Elastic 中国社区官方博客
tags:
篇首语:本文由小常识网(cha138.com)小编为大家整理,主要介绍了Beats:使用 fingerprint 来连接 Beats/Logstash 和 Elasticsearch相关的知识,希望对你有一定的参考价值。
针对带有 HTTPS 访问的 Elasticsearch 集群来说,在我之前的很多文章,我都习惯于使用集群的证书来访问 Elasticsearch。你可以参考我之前的文章 “Elastic Stack 8.0 安装 - 保护你的 Elastic Stack 现在比以往任何时候都简单”。这是一种非常简便的方法。好处是,我们可以随时使用在安装过程中的证书来访问 Elasticsearch。一个很大的缺点就是,我们必须拷贝证书,并把它放到 Beats 或者 Logstash 可以访问的位置进行配置。这个在使用的过程中非常不方便。相反,我们可以使用 fingerprint 来进行配置 Beats 及 Logstash。Fingerprint 的好处是它不用带路径。在配置的时候,我们所需要做的就是把 fingerprint 的值拷贝进来就可以了,而无须去配置路径。
使用 fingerprint 来连接 Beats:Logstash 和 Elasticsearch
如何得到 fingerprint ?
我们可以通过如下的几种方法来得到 Elasticsearch 集群的 fingerprint。
第一次 Elasticsearch 启动时的输出
针对 Elastic Stack 8.x 的安装来说,在我们第一次启动的时候,我们就可以看到 fingerprint 的输出:

从上面的输出中我们可以看到 fingerprint 的输出。
从 Kibana 的配置中得到
在很多的时候,我们没有记下 Elasticsearch 第一次启动时的 fingerprint 的输出。那我们该怎么办呢?另外一种方法就是从 Kibana 的配置文件中,我们可以得到这个信息。我们打开 config/kibana.yml 文件,并查看最后的一行:
config/kibana.yml

很显然,我们在上面的文件中查看到 fingerprint 的值。
通过证书来获得
我们可以在 Elasticsearch 的安装目录中查看到证书所在的位置:
$ pwd
/Users/liuxg/elastic/elasticsearch-8.6.1
$ ls config/certs/
http.p12      http_ca.crt   transport.p12
从上面的显示中,我们可以看到在安装过程中,Elasticsearch 生成的三个证书文件。我们使用如下的命令来获得 fingerprint:
openssl x509 -fingerprint -sha256 -in config/certs/http_ca.crt
在实际的使用中,我们需要使用到没有冒号的 fingerprint。我们可以使用如下的命令来进行生成:
openssl x509 -in config/certs/http_ca.crt -sha256 -fingerprint | grep sha256 | sed 's/://g'$ pwd
/Users/liuxg/elastic/elasticsearch-8.6.1
$ openssl x509 -in config/certs/http_ca.crt -sha256 -fingerprint | grep sha256 | sed 's/://g'
sha256 Fingerprint=F8FA6EA4326C13224D952C5E0B2D36AFB18135A505EF41FC25490EBB5A652122上面的输出结果显示的是没有冒号的 fingerprint。
通过 openssl s_client 来获得
如果你无权访问 Elasticsearch 生成的 CA 文件,你可以使用以下脚本通过 openssl s_client 输出 Elasticsearch 实例的根 CA fingerprint:
openssl s_client -connect localhost:9200 -servername localhost -showcerts </dev/null 2>/dev/null | while openssl x509 -sha256 -subject -issuer -fingerprint -noout 2>/dev/null; do :; done$ openssl s_client -connect localhost:9200 -servername localhost -showcerts </dev/null 2>/dev/null | while openssl x509 -sha256 -subject -issuer -fingerprint -noout 2>/dev/null; do :; done
subject=CN = liuxgm.local
issuer=CN = Elasticsearch security auto-configuration HTTP CA
sha256 Fingerprint=F1:C7:FD:E5:3F:0D:9D:AD:54:FD:6A:C9:76:7B:C4:E9:37:F3:C7:F5:C1:5A:8B:FC:E3:7C:AD:C2:25:96:2D:F8
subject=CN = Elasticsearch security auto-configuration HTTP CA
issuer=CN = Elasticsearch security auto-configuration HTTP CA
sha256 Fingerprint=F8:FA:6E:A4:32:6C:13:22:4D:95:2C:5E:0B:2D:36:AF:B1:81:35:A5:05:EF:41:FC:25:49:0E:BB:5A:65:21:22配置 Beats
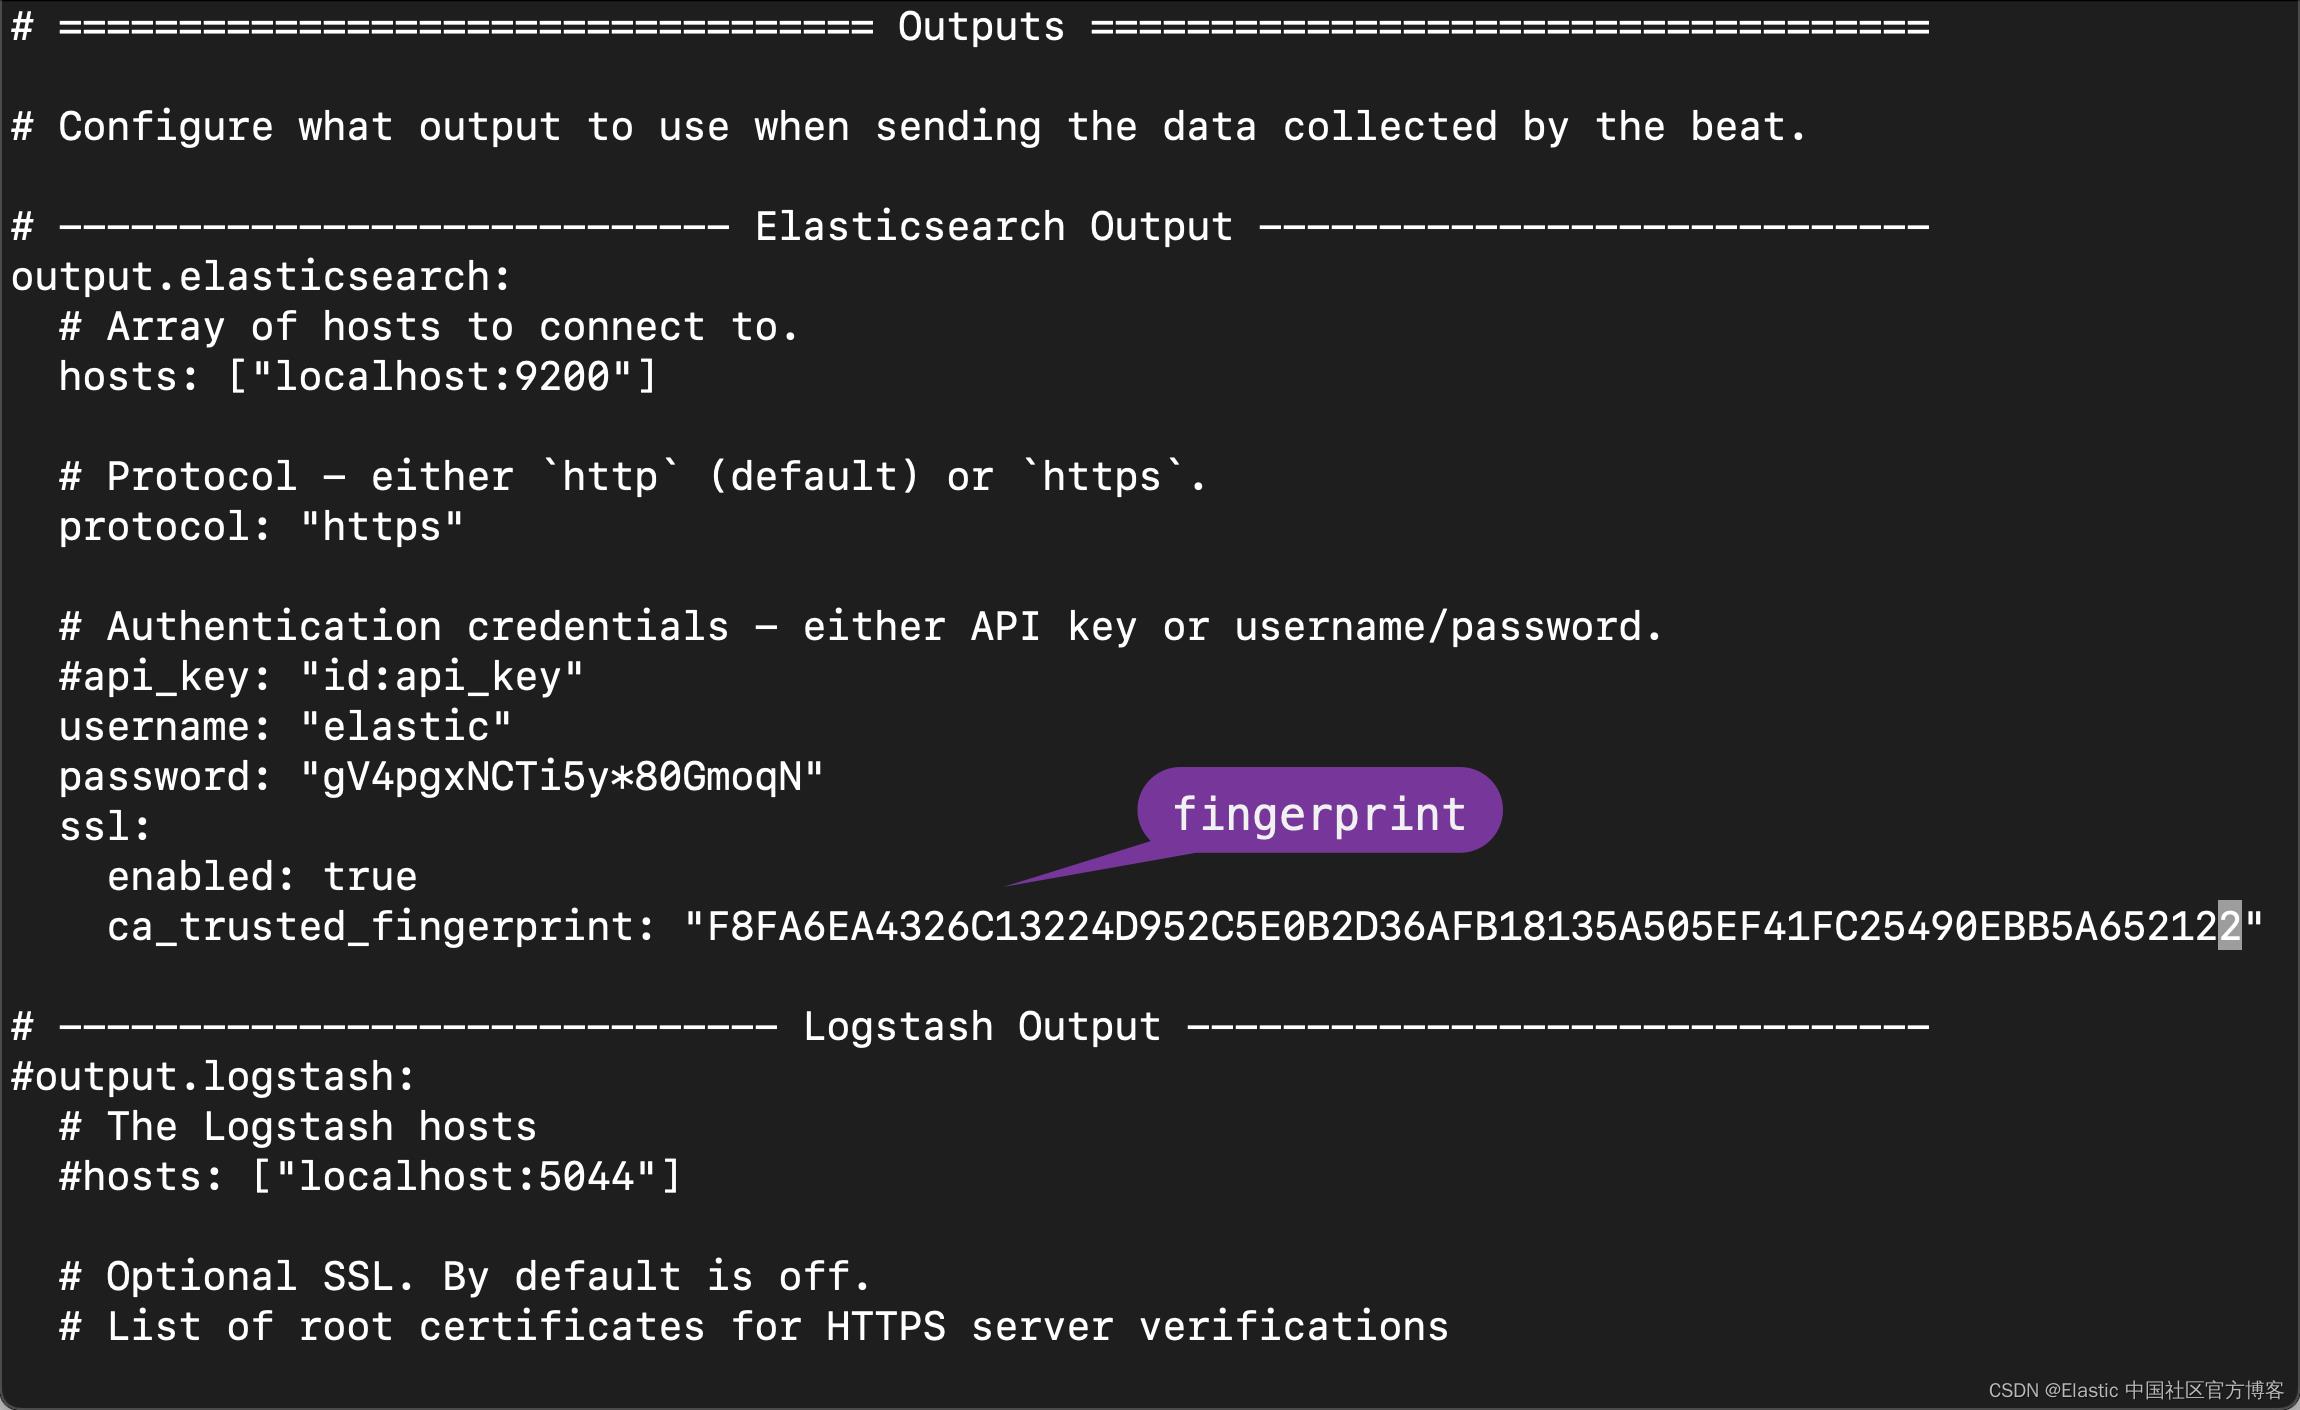
一旦得到 Elasticsearch 集群证书的 fingerprint,我们可以通过如下的方式来配置 Beats,比如 Metricbeat。我们可以编辑 Metricbeat 的配置文件 metricbeat.yml 文件:
output.elasticsearch:
  # Array of hosts to connect to.
  hosts: ["localhost:9200"]

  # Protocol - either `http` (default) or `https`.
  protocol: "https"

  # Authentication credentials - either API key or username/password.
  #api_key: "id:api_key"
  username: "elastic"
  password: "gV4pgxNCTi5y*80GmoqN"
  ssl:
    enabled: true
    ca_trusted_fingerprint: "F8FA6EA4326C13224D952C5E0B2D36AFB18135A505EF41FC25490EBB5A652122"
如上所示,我们配置 ssl 项,并把从上面获得的 fingerprint 填入:
我们可以打入如下的命令来进行测试:
$ pwd
/Users/liuxg/elastic/metricbeat-8.6.1-darwin-aarch64
$ ./metricbeat test config
Config OK
$ ./metricbeat test output
elasticsearch: https://localhost:9200...
  parse url... OK
  connection...
    parse host... OK
    dns lookup... OK
    addresses: ::1, 127.0.0.1
    dial up... OK
  TLS...
    security: server's certificate chain verification is enabled
    handshake... OK
    TLS version: TLSv1.3
    dial up... OK
  talk to server... OK
  version: 8.6.1
上面表明我们的 fingerprint 的配置是成功的。它可以连接到 Elasticsearch。我们可以通过如下的命令来生成相应的 Dashboard:
$ pwd
/Users/liuxg/elastic/metricbeat-8.6.1-darwin-aarch64
$ ./metricbeat setup
Overwriting ILM policy is disabled. Set `setup.ilm.overwrite: true` for enabling.

Index setup finished.
Loading dashboards (Kibana must be running and reachable)
Loaded dashboards
上面显示我们已经成功地上传了 Dashboard。我们可以通过如下的命令来启动 Metricbeat:

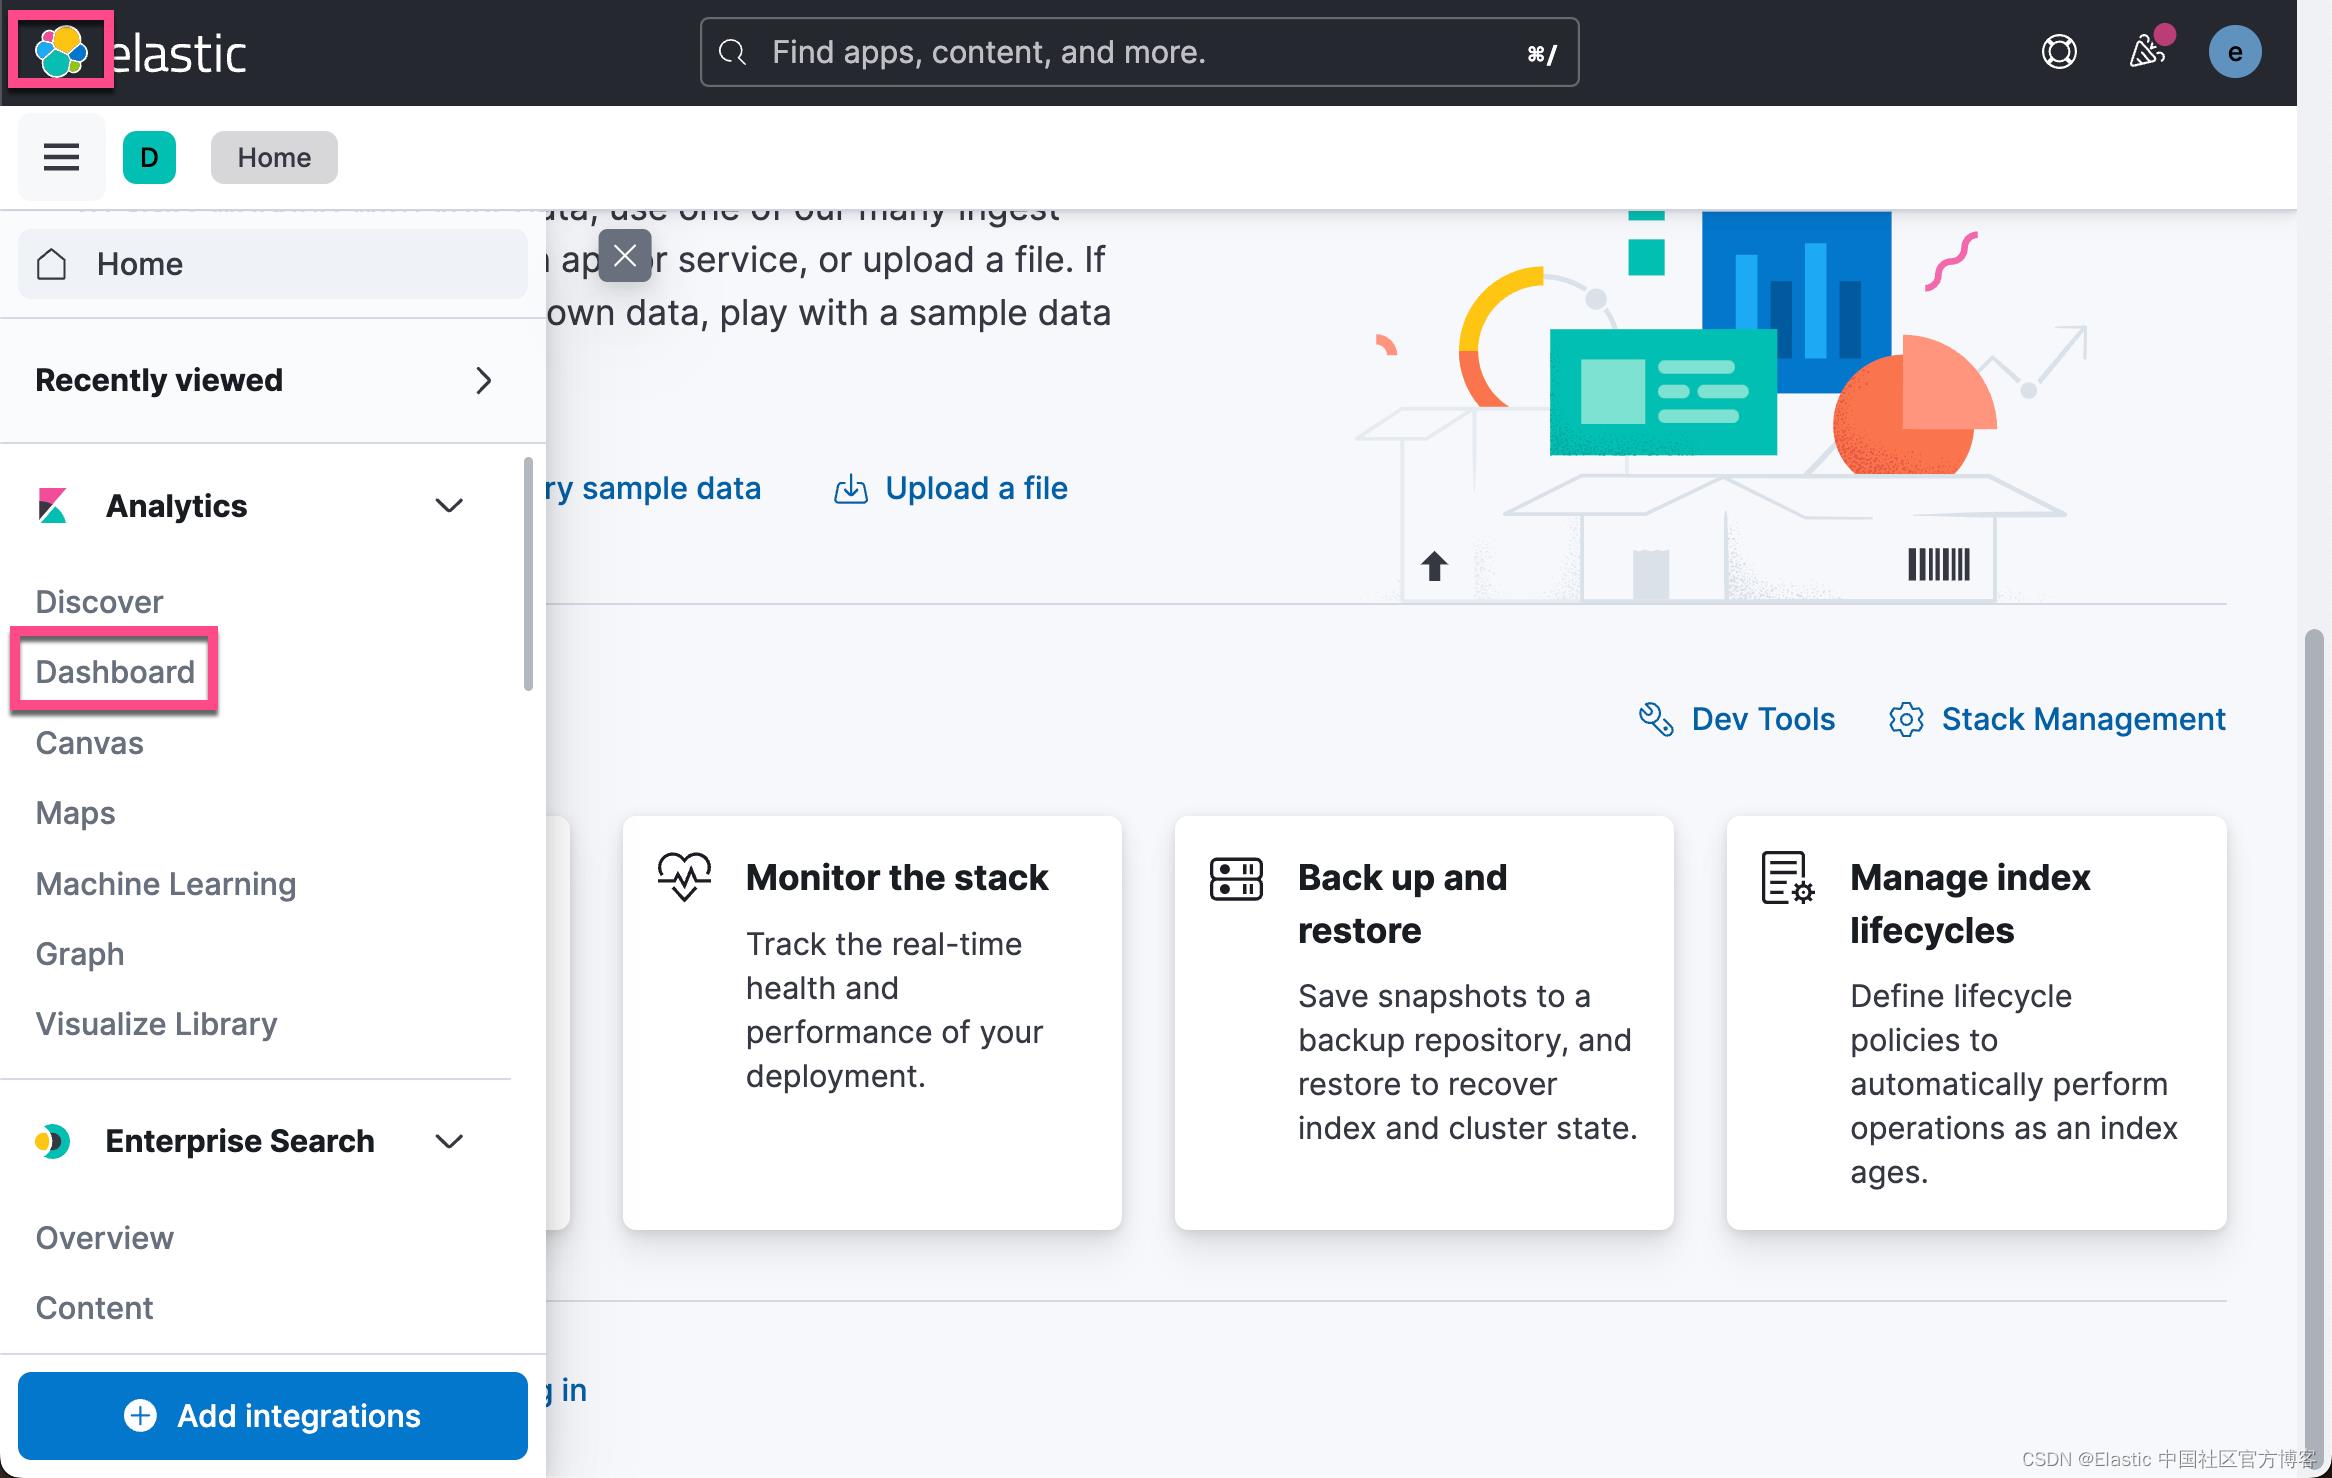
我们可以在 Kibana 中查看 System 模块的 Dashbord:

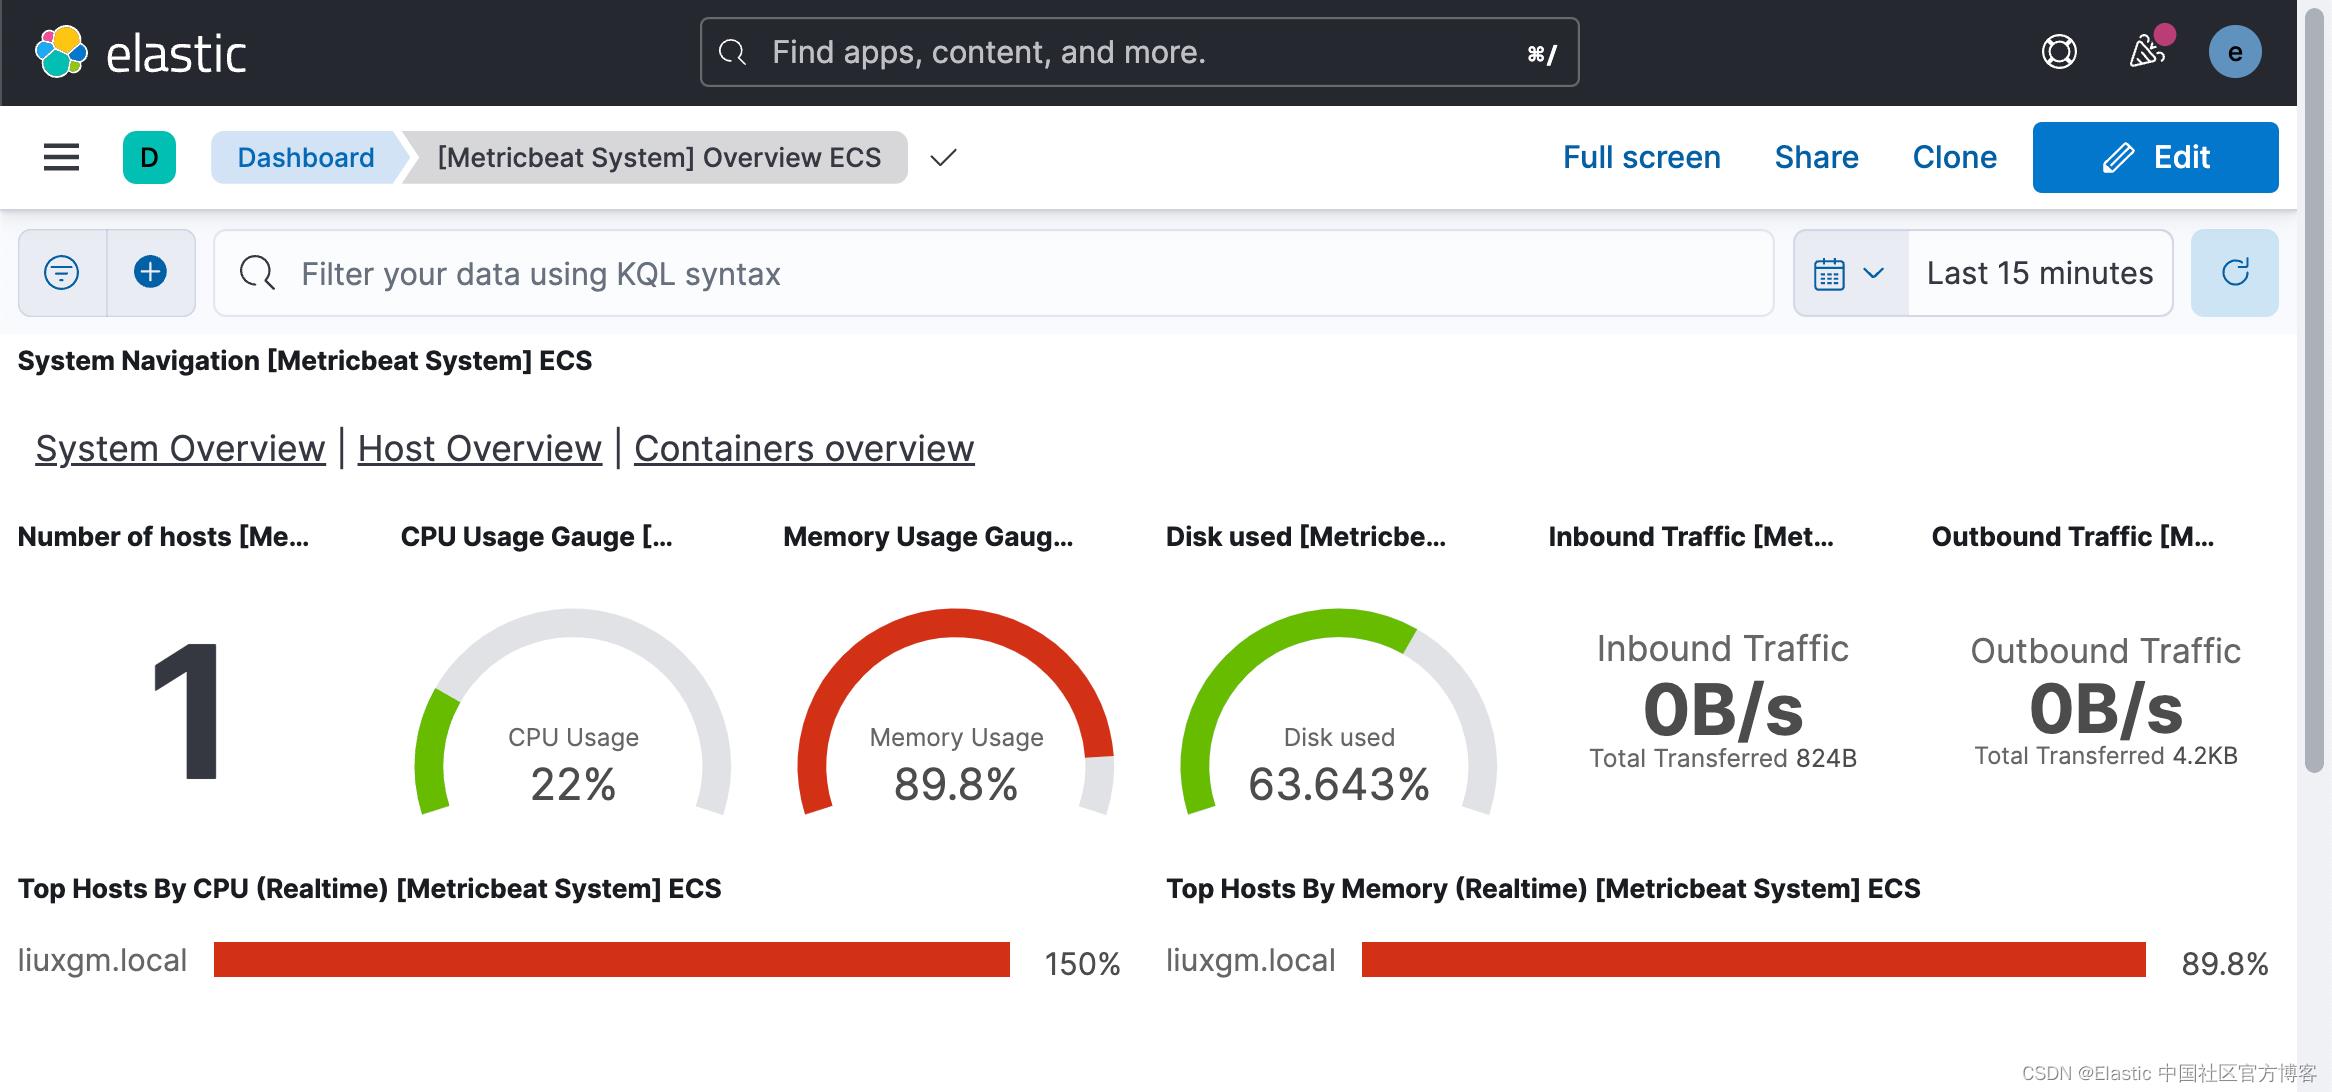 从上面我们可以看到 HOST 机器的指标信息。
Logstash 连接
同样地,我们也可以在 Logstash 的配置中使用 fingerprint。我们可以参照文档 Elasticsearch output plugin | Logstash Reference [8.6] | Elastic。我们使用如下的配置文件:
logstash.conf
input
  generator
    message => '"id":2,"timestamp":"2019-08-11T17:55:56Z","paymentType":"Visa","name":"Darby Dacks","gender":"Female","ip_address":"77.72.239.47","purpose":"Shoes","country":"Poland","age":55'
    count => 1


filter
    json
        source => "message"


    if [paymentType] == "Mastercard"
        drop


    mutate
        remove_field => ["message", "@timestamp", "path", "host", "@version", "log", "event"]


output
  stdout
    codec => rubydebug


  elasticsearch
    hosts => ["https://localhost:9200"]
    index => "data-%+YYYY.MM.dd"
    user => "elastic"
    password => "gV4pgxNCTi5y*80GmoqN"
    ssl => true
    ca_trusted_fingerprint => "F8FA6EA4326C13224D952C5E0B2D36AFB18135A505EF41FC25490EBB5A652122"
我们使用如下的命令来启动 Logstash:
$ pwd
/Users/liuxg/elastic/logstash-8.6.1
$ ./bin/logstash -f logstash.conf

上面显示我们已经成功地写入一条文档到 Elasticsearch 中去了。我们到 Kibana 中进行查看:
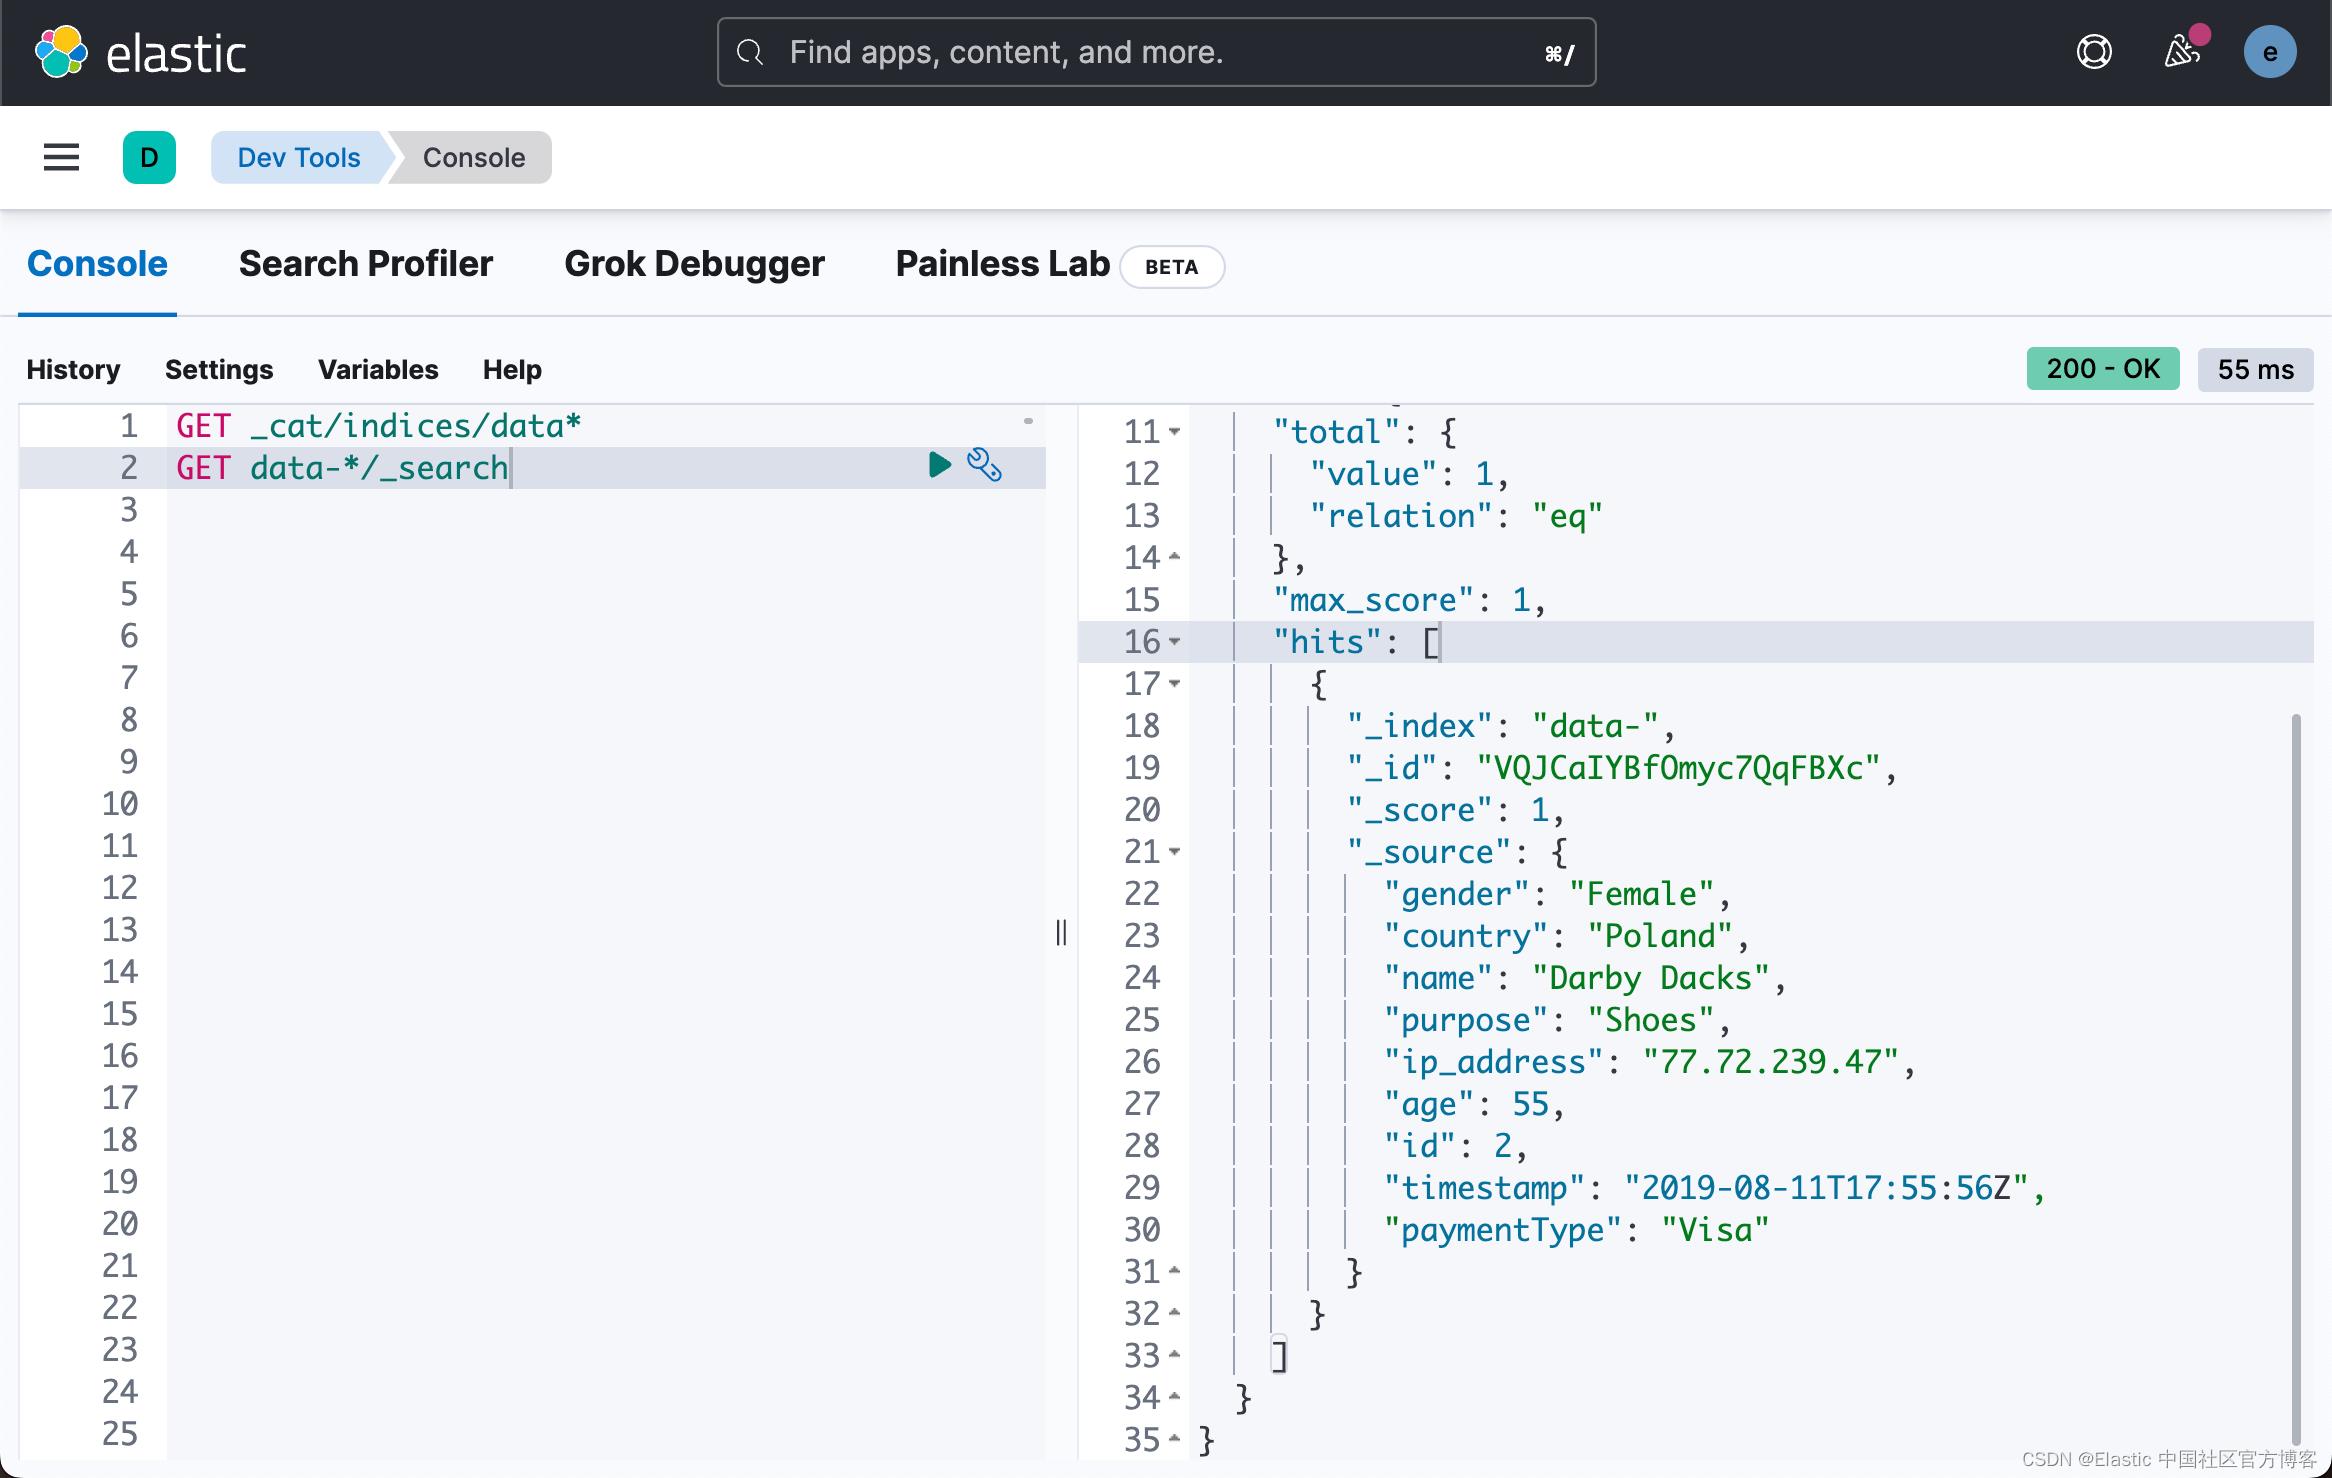
从上面,我们可以看出来,文档已经被成功地写入到 Elasticsearch 中去了。
好了,今天的分享就到这里。祝大家学习愉快!
以上是关于Beats:使用 fingerprint 来连接 Beats/Logstash 和 Elasticsearch的主要内容,如果未能解决你的问题,请参考以下文章