数据可视化之Highcharts
Posted Icy Hunter
tags:
篇首语:本文由小常识网(cha138.com)小编为大家整理,主要介绍了数据可视化之Highcharts相关的知识,希望对你有一定的参考价值。
文章目录
前言
highcharts真的好,加载快,代码易懂,先举个气泡图例子看看
气泡图
https://www.hcharts.cn/demo/highcharts/bubble/grid-light
进入代码编辑模式,然后随便改改代码,把数据放进去:
var chart = Highcharts.chart('container',
	chart:
		type: 'bubble',
		zoomType: 'xy',
		width:500,
		height:450
	,
	title:
		text: 'Highcharts 气泡图'
	,
	series: [
		name:'特征均值',
		// 每个气泡包含三个值,x,y,z;其中 x,y用于定位,z 用于计算气泡大小
		data: [[1, 0, 0.16037308754486707],
			   [1, 1, 0.4973990776641518],
			   [1, 2, 0.28370786516853935],
			   [1, 3, 0.5842696629213483],
			   [1, 4, 0.08426966292134831],
			   [1, 5, 0.2439807383627608],
			   [2, 0, 0.2197921865463983],
			   [2, 1, 0.4853193175283686],
			   [2, 2, 0.3076923076923077],
			   [2, 3, 0.6043956043956044],
			   [2, 4, 0.16483516483516483],
			   [2, 5, 0.20094191522762941],
			   [3, 0, 0.24295098745554658],
			   [3, 1, 0.43004276859701784],
			   [3, 2, 0.28370786516853935],
			   [3, 3, 0.5880149812734082],
			   [3, 4, 0.29775280898876405],
			   [3, 5, 0.23916532905296944],
			   [0, 0, 0.1414458465896553],
			   [0, 1, 0.5399072921896946],
			   [0, 2, 0.3472222222222222],
			   [0, 3, 0.6074074074074074],
			   [0, 4, 0.044444444444444446],
			   [0, 5, 0.23809523809523803]]
	],
	yAxis:
		labels:
			formatter:function()
				if(this.value ==0)
					return "commonality";
				else if(this.value==1)
					return "letter_utilization";
				else if(this.value==2)
					return "type_num";
				else if(this.value==3)
					return "vowel_num";
				else if(this.value == 4)
					return "repeat_num"
				else if(this.value == 5)
					return "couple_n"


		,
		title:
			text:'特征类别'

	,
	xAxis:
		labels:
			formatter:function()
				if(this.value <=0)
					return "Easy";
				else if(this.value<=1)
					return "Lower-Intermediate";
				else if(this.value<=2)
					return "Upper-Intermediate";
				else return "Difficult";


);
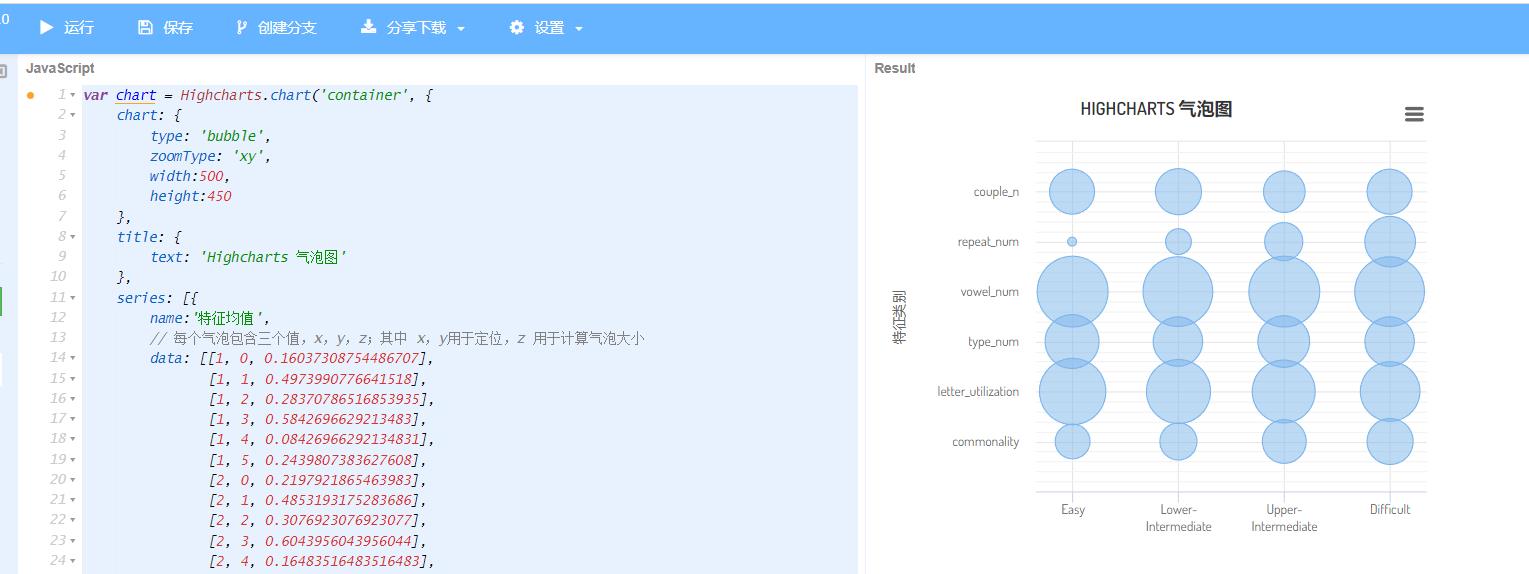
点击左上角运行,即可得出结果。
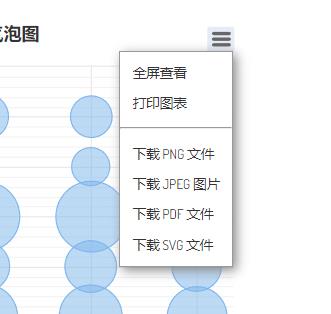
调整好后,下载就能用了。
不过记得改好代码记得保存,不然就白搞了。
以上是关于数据可视化之Highcharts的主要内容,如果未能解决你的问题,请参考以下文章