nature论文精读Impedance-based forecasting of lithium-ion battery performance amid uneven usage
Posted 程序媛小哨
tags:
篇首语:本文由小常识网(cha138.com)小编为大家整理,主要介绍了nature论文精读Impedance-based forecasting of lithium-ion battery performance amid uneven usage相关的知识,希望对你有一定的参考价值。
【nature论文精读】 Impedance-based forecasting of lithium-ion battery performance amid uneven usage
文章目录
- 【nature论文精读】 Impedance-based forecasting of lithium-ion battery performance amid uneven usage
- Data efficiency and robustness to domain shift
论文链接:https://www.nature.com/articles/s41467-022-32422-w.pdf
Accurate forecasting of lithium-ion battery performance is essential for easing consumer concerns about the safety and reliability of electric vehicles. Most research on battery health prognostics focuses on the research and development setting where cells are subjected to the same usage patterns. However, in practical operation, there is great variability in use across cells and cycles, thus making forecasting challenging. To address this challenge, here we propose a combination of electrochemical impedance spectroscopy measurements with probabilistic machine learning methods. Making use of a dataset of 88 commercial lithium-ion coin cells generated via multistage charging and discharging (with currents randomly changed between cycles), we show that future discharge capacities can be predicted with calibrated uncertainties, given the future cycling protocol and a single electrochemical impedance spectroscopy measurement made immediately before charging, and without any knowledge of usage history. The results are robust to cell manufacturer, the distribution of cycling protocols, and temperature. The research outcome also suggests that battery health is better quantified by a multidimensional vector rather than a scalar state of health.
锂离子电池性能的准确预测对于缓解消费者对电动汽车安全性和可靠性的担忧至关重要。大多数关于电池健康预测的研究都集中在电池处于相同使用模式的研发环境中。然而,在实际操作中,跨细胞和周期的使用存在很大的可变性,因此预测具有挑战性。为了解决这一挑战,我们在这里提出了电化学阻抗谱测量与概率机器学习方法的结合。利用88个通过多级充放电产生的商业锂离子硬币电池的数据集(在周期之间电流随机变化),我们表明,考虑到未来的循环协议和充电前立即进行的单一电化学阻抗谱测量,并且不需要任何使用历史知识,可以用校准的不确定性预测未来的放电容量。结果对电池制造商、循环协议的分布和温度具有鲁棒性。研究结果还表明,电池健康状况可以通过多维向量而不是标量状态来更好地量化。
Electrification of the transportation industry is now taking place at an increasingly rapid pace, enabling significant strides towards a carbon neutral future. Fundamental to this transition has been the development of the lithium-ion battery, which powers the majority of electric vehicles (EVs) on the road today. Notwithstanding the environmental benefits of this transition, reliance on the lithium-ion battery poses significant challenges, with consumer concerns including range anxiety, fear of battery failure and charging time. Easing these concerns demands the ability to accurately forecast battery performance, and specifically when usage conditions are variable.
交通运输业的电气化正在以越来越快的速度进行,使我们能够在实现碳中和的未来方面取得重大进展。这一转变的基础是锂离子电池的发展,目前在路上行驶的大多数电动汽车都是由锂离子电池驱动的。尽管这种转变对环境有利,但对锂离子电池的依赖带来了重大挑战,消费者担心的问题包括里程焦虑、电池故障和充电时间。缓解这些担忧需要准确预测电池性能的能力,特别是当使用条件变化时。
The key challenge is the heterogeneity of the battery. Each user uses their car differently, and even across a single battery pack not all cells are necessarily charged or discharged with identical current.
关键的挑战是电池的异质性heterogeneity。每个用户使用汽车的方式都不同,即使是在一个电池组中,也不是所有的电池都必须以相同的电流充电或放电。
These differences mean that each cell’s internal state, including the extent of lithium plating or electrode cracking, can vary significantly both at an intra-pack and inter-pack level.
这些差异意味着每个电池的内部状态,包括锂电镀或电极开裂的程度,在电池组内和电池组间的水平上都可能存在显著差异。
To quantify the extent of degradation within cells, and to identify cells that have reached their End of Life (in EVs, this is typically defined as the point at which the discharge capacity has reduced to 80% of the nominal capacity), the scalar State of Health (SOH) metric is typically adopted, measured using previous cycle discharge capacity or internal resistance8–13. The problem with this approach is that batteries with the same numerical SOH do not necessarily exhibit identical levels of each degradation process (for example, lithium plating or electrode cracking), yet the impact of future cell usage on the cell’s future performance and degradation pathway depends significantly on the type of degradation that has already occurred14–16. Accurate forecasting of battery performance demands a non-invasive approach to acquire information about the cell state at a microscopic level.
为了量化锂电池单体内的退化程度,并识别已达到生命终点的锂电池单体(在电动汽车中,这通常定义为放电容量降低到标称容量的80%的点),通常采用标量健康状态(SOH)度量,使用以前的循环放电容量或内阻测量。这种方法的问题是,具有相同数值SOH的电池在每个降解过程中不一定表现出相同的水平(例如,锂电镀或电极开裂),但未来电池使用对电池的性能和降解途径的影响取决于已经发生的降解。电池性能的准确预测需要一种非侵入性的方法来获取微观水平上电池状态的信息。
Both short and long timescale forecasting of battery performance are of interest in battery prognostics. Over a short timescale, predicting how the battery would respond to a particular charging and discharging protocol can be used to develop optimal charging protocols. Short-term forecasting also encompasses SOH estimation: here, the aim is to predict the battery’s discharge capacity or internal resistance under a specific, standardised cycling protocol. Over a long timescale, the focus is on predicting the remaining useful life, end of life, or the ‘knee-point’ in the battery’s life trajectory at which degradation accelerates.
电池性能的短和长时间尺度预测在电池预测中都是感兴趣的。在短时间内,预测电池将如何响应特定的充放电协议,可用于开发最佳充电协议。短期预测还包括SOH估计:在这里,目标是在特定的标准化循环协议下预测电池的直流电阻容量或内阻。在很长一段时间内,研究的重点是预测剩余的使用寿命,即寿命的结束,或者电池寿命轨迹中加速退化的“膝点”。
Approaches to both types of forecasting can be subdivided into empirical, physics-based, and data-driven models, with some models being a hybrid of these.
Empirical approaches have been used to model long-term capacity fade with power laws but assume fixed operation over battery life and do not account for intrinsic differences in cell state at start of life. These approaches assume that all cells of the same chemistry will fade in the same way if operated in the same way, which is not observed in practice.
In physics-based approaches, the battery is either modelled mechanistically using first principles analysis of internal physical and electrochemical processes, or using equivalent circuit modelling, which models the cell as a circuit comprising resistors and capacitors that are representative of the underlying electrochemical processes. Mechanistic models aim to capture how the battery voltage responds to an externally applied current (or vice versa), which can be used to predict optimal charging protocols.However, the parameters of such models need to be updated for each individual cell and typically suffer from non-identifiability – several sets of model parameters could explain the observed data equally well, but would make drastically different predictions on test cells or on the same cell later in its life.
这两种类型的预测方法可以细分为经验模型、基于物理的模型和数据驱动模型,有些模型是这些模型的混合。
经验方法Empirical approaches已被用于模拟长期容量随功率定律衰减,但假设在电池寿命期间固定运行,不考虑电池寿命开始时状态的内在差异。这些方法假设所有具有相同化学性质的锂电池单体如果以相同的方式操作,将以相同的方式褪色,这在实践中没有观察到。
在基于物理的方法physics-based approaches中,电池要么使用内部物理和电化学过程的第一性原理分析进行机械建模,要么使用等效电路建模,将电池建模为包含代表底层电化学过程的电阻和电容的电路。 机械模型旨在捕捉电池电压如何响应外部施加的电流(反之亦然),可用于预测最佳充电协议。然而,这种模型的参数需要为每个单独的锂电池单体更新,并且通常存在不可识别性——几组模型参数可以同样很好地解释观察到的数据,但会对测试锂电池单体或同一锂电池单体后期的生命周期做出截然不同的预测。
For circuit-based models, the parameters of the circuit can be fitted to either current-voltage data, or to electrochemical impedance spectra. The circuit parameters can then be used to forecast capacity degradation under standardised use conditions or to simulate the effect of different usage conditions on battery pack performance30. However, it is challenging to capture every degradation mode in an analytical model. Further, a new set of model parameters must be learnt for each cell from cycle to cycle, making it challenging to infer a general cell-to-cell model.
对于基于电路的模型,电路的参数可以拟合到电流-电压数据,或电化学阻抗谱。然后,电路参数可用于预测标准化使用条件下的容量退化或模拟不同使用条件对电池组性能的影响。然而,在分析模型中捕获每种退化模式.是具有挑战性的。此外,从一个周期到另一个周期,每个细胞都必须学习一组新的模型参数,这使得推断一个一般的细胞到细胞模型具有挑战性。
Purely data-driven approaches to forecasting use raw data as input to a machine learning algorithm to forecast long term capacity fade, resistance increase and remaining useful life. Feature - based data-driven approaches applied machine learning on features extracted from the charging or discharging curve to predict discharge capacity, remaining useful life, and abrupt capacity decays.
Innovations in extracting features from charge/discharge curves and machine learning approaches for modelling time-series data have enabled significant improvements in the accuracy of predictions.
Further studies showed that using features of the discharge curve across a small number of initial cycles, it is possible to train machine learning models that can generalise to different cell chemistries.
Going beyond charging and discharging curves, approaches such as electrochemical impedance spectroscopy (EIS), early cycle Coulombic efficiency, current interruption and acoustic time-of-flight analysis have been used for degradation forecasting. These approaches provide a fuller description of battery state – for example, EIS captures the response of the cell over a broad frequency range, with different frequencies correlating to distinct physical, chemical and mechanical changes in the active material. Data - driven methods typically utilise data generated in the laboratory setting, where cells are charged and discharged in the same way over the entirety of their lifetimes, thus the impact of variable cell usage on future performance can be ignored (see Fig. 1). However, extrapolating the models developed for laboratory setting to field data or other realistic usage profiles such as the Worldwide Harmonized Light Vehicles Test Cycles (WLTC), where cells are cycled in vastly different ways over their lifetimes, has proved a major challenge.
纯数据驱动的预测方法使用原始数据作为机器学习算法的输入,来预测长期容量衰退、阻力增加和剩余使用寿命。数据驱动方法将机器学习应用于从充电或放电曲线中提取的特征,以预测放电容量、剩余使用寿命和容量突然衰减。
从充放电曲线中提取特征和时间序列数据建模的机器学习方法的创新,使得预测的准确性有了显著提高。
进一步的研究表明,利用少量初始周期的放电曲线特征,可以训练出可以推广到不同细胞化学性质的机器学习模型。
除了充电和放电曲线之外,电化学阻抗谱(EIS)、早周期库仑效率、电流中断和声学飞行时间分析等方法已用于降解预测。
这些方法提供了对电池状态更全面的描述——例如,EIS捕获了电池在宽频率范围内的响应,不同的频率与活性材料中不同的物理、化学和机械变化相关。
数据驱动方法方法通常利用在实验室环境中产生的数据,其中电池在其整个生命周期内以相同的方式充电和放电,因此可以忽略可变电池使用对未来性能的影响(见图1)。然而,将为实验室环境开发的模型外推算到现场数据或其他实际使用概况,如全球协调轻型车辆测试周期(WLTC),锂电池单体在其一生中以截然不同的方式循环,这已被证明是一个重大挑战。

Fig. 1 | Schematic comparison of the proposed approach to previous research works. Feature-based methodologies for degradation prediction have focused on constant charging protocols (the blue/red curve denotes the charge/discharge phase), using features from capacity–voltage curves as input. This necessitates knowledge of historic charging data. Our approach considers variable charging protocols (the shaded blue/red region denotes the range of currents that the charge/discharge protocols are drawn from), which is more comparable to the EV setting. Further, we employ the electrochemical impedance spectrum measured just before charging as input, without any knowledge of historic data, and predict the impact of different future usage protocols on the discharge capacity.
图1 |所提方法与以往研究工作的对比示意图。
基于特征的退化预测方法专注于恒定充电协议(蓝色/红色曲线表示充电/放电阶段),使用容量-电压曲线的特征作为输入。这强调了历史收费数据的知识的重要性。
我们的方法考虑了可变充电协议(蓝色/红色阴影区域表示充电/放电协议的电流范围),这更类似于电动汽车设置。此外,我们使用充电前测量的电化学阻抗谱作为输入,不了解任何历史数据,并预测未来不同使用协议对放电容量的影响。
In this work, we seek to identify whether there exists a sufficiently informative marker of cell health that can be used to forecast shortterm and longer term future performance, amid uneven historical and future cell usage. Figure 1 provides an illustration of our approach, and how it differs from previous approaches. We find that upon acquisition of an EIS spectrum just before charging, both next cycle and longer term cell capacity can be predicted with a test error of less than 10%.
When testing on cells subjected to similar cycling conditions to those used to train the model, our model achieves comparable accuracy to state-of-the-art forecasting models (8.2% test error versus 8.8% test error), except that our model enables forecasting with no access to any historical data, whereas previous state-of-the-art models require historical data from the cell’s cycling trajectory. In addition, when extrapolating to different operating temperatures, our model significantly outperforms the state-of-the-art model, achieving a 57% reduction in test error (from 34.2% to 14.6%).
在这项工作中,我们试图确定是否存在一个足够信息的锂电池单体健康标记,可以用来预测短期和长期的未来性能,在不平衡的历史和未来锂电池单体使用。图1展示了我们的方法,以及它与以前的方法的不同之处。我们发现,在充电前获取EIS频谱,可以预测下一个周期和更长期的电池容量,测试误差小于10%。
当在与用于训练模型的周期条件相似的锂电池单体上进行测试时,我们的模型达到了与最先进的预测模型相当的精度(8.2%的测试误差对8.8%的测试误差),除了我们的模型可以在不访问任何历史数据的情况下进行预测,而以前的最先进的模型需要来自细胞周期轨迹的历史数据。此外,当外推到不同的工作温度时,我们的模型显著优于最先进的模型,测试误差降低了57%(从34.2%降至14.6%)。
We observe that our model is data-efficient, requiring just eight cells to attain a test error of less than 10%. Crucially, our approach is robust to dataset shift, attaining a test error of less than 7% on a dataset with a different distribution of cycling patterns to the training set. This is important for deployment in the field where driving patterns may be different from those used to train the model. We additionally demonstrate that, if available, using additional features based on historical capacity–voltage data can serve to augment the state representation and reduce average test error by up to 25%. Our approach is robust with respect to cell manufacturer, average usage pattern and operating temperature.
我们观察到,我们的模型是数据高效 data-efficient的,只需要8个单元就可以获得小于10%的测试误差。
至关重要的是,我们的方法对数据集偏移dataset shift具有鲁棒性,在具有不同循环模式分布的数据集上获得小于7%的测试误差。这对于在驾驶模式可能不同于用于训练模型的驾驶模式的现场部署非常重要。
我们还证明,如果可用,使用基于历史容量-电压数据的附加特征可以增强状态表示,并将平均测试误差降低高达25%。我们的方法在电池制造商、平均使用模式和操作温度方面是稳健的。
Further, our work fills a gap in publicly available data by contributing a large corpus of cycling data on cells under dynamic working conditions. Our work focuses on a set of idealised usage distributions rather than realistic driving profile in order to demonstrate the extent of generalisability of the model. Our work departs from the NASA randomised usage dataset, which randomly cycles cells for 50 cycles before measuring the next cycle discharge capacity after charging via a ‘reference’ protocol. Although several models for forecasting degradation under randomised conditions have been built based on this data, the effect of a single protocol on next cycle discharge capacity cannot be disentangled, and there is a need for a reference charge/discharge protocol every few cycles which does not concord with typical field usage.
此外,我们的工作通过提供动态工作条件下锂电池单体循环数据的大型语料库,填补了公开数据的空白。我们的工作侧重于一组理想化的使用分布,而不是现实的驾驶剖面,以证明模型的泛化程度。我们的工作脱离了NASA的随机使用数据,该数据随机循环电池50个周期,然后通过“参考”协议充电后测量下一个周期的放电容量。尽管基于这些数据已经建立了在随机条件下预测退化的几个模型,但单个协议对下一个周期放电容量的影响无法解耦,并且需要每隔几个周期就有一个参考充电/放电协议,这与典型的现场使用情况不一致。
Result
Data generation
For this study, we generate two separate datasets corresponding to commercial LiR coin cells 锂离子可充电钮扣电池 purchased from two different manufacturers, which allows us to test whether our approach is robust with respect to cell manufacturer.
在这项研究中,我们生成了两个独立的数据集,对应于从两个不同的制造商购买的商业锂离子可充电钮扣电池,这使我们能够测试我们的方法对于电池制造商是否稳健。
The first dataset corresponds to 40 Powerstream LiR 2032 coin cells (nominal capacity 1C = 35 mAh). We subject 24 cells to a sequence of randomly selected charge and discharge currents at 23 ± 2 °C for 110–120 full charge/discharge cycles. Each cycle consists of an initial diagnosis of battery state, involving acquisition of the galvanostatic EIS spectrum, followed by usage, involving a charging and discharging stage. Charging and discharging consist of a two stage and one stage Constant Current (CC) protocol, respectively; the currents are randomly selected at each cycle in the ranges 70–140 mA (2–4 C ) , 35–105 mA (1–3 C), and 35–140 mA (1–4 C) respectively. To test the model’s robustness to domain shift, we additionally cycle the remaining 16 cells under the same conditions as above, except now fixing the discharge current for all cells and cycles at 52.5mA (1.5 C) instead of randomly changing the discharge current at each cycle. The space of protocols considered is illustrated in Fig. 2 and an example of the capacity trajectories of three cells is provided in Supplementary Fig. 1 for illustration of the difference from typical monotonic capacity fade experiments. A complete description of cycling protocols is provided in the Methods and the full set of operating conditions that each cell is subjected to is detailed in Supplementary Table 1.Having used the first dataset to confirm the approach can successfully forecast discharge capacity several cycles ahead, we later significantly expand our analysis to explore the model’s robustness to cell manufacturer, changes to usage pattern and operating temperature. To achieve this, we cycle an additional 48 cells from a second manufacturer, RS Pro (nominal capacity 40 mAh), under a much wider range of usage patterns. In this case, each cell is again subjected to 100 cycles of two-stage CC charging, and one-stage CC discharging, with the three rates randomly selected at the start of each cycle. However, we now make the problem more challenging by having a different distribution of currents for each cell, to replicate the scenario in which different battery users have different average usage patterns to each other, but still exhibit random cycle-to-cycle behaviour. Of these cells, sixteen are also cycled at a higher operating temperature of 35 °C.
第一个数据集对应于40个Powerstream LiR 2032锂离子可充电钮扣电池(标称容量1C = 35 mAh)。我们将24个电池置于随机选择的23±2°C充放电电流序列中,进行110-120个完整的充放电循环。每个周期包括电池状态的初始诊断,包括恒流EIS谱的获取,然后是使用,包括充电和放电阶段。充电和放电分别由两级和一级恒流(CC)协议组成;电流分别在70-140 mA (2-4 C)、35-105 mA (1-3 C)和35-140 mA (1-4 C)的范围内随机选择。
为了测试模型对域移位的鲁棒性,我们在上述相同的条件下对其余16个单元进行循环,除了现在将所有单元的放电电流固定在52.5mA (1.5 C),而不是在每个周期随机改变放电电流。
所考虑的协议空间如图2所示,补充图1中提供了三个单元的容量轨迹示例,以说明与典型单调容量衰减实验的差异。方法中提供了对循环方案的完整描述,补充表1详细描述了每个单元所承受的全套操作条件。在使用第一个数据集确认该方法可以成功预测几个周期前的放电容量后,我们随后显著扩展了我们的分析,以探索模型对电池制造商、使用模式变化和工作温度的相关性。
为了实现这一目标,我们在更广泛的使用模式下,从另一家制造商RS Pro(标称容量40毫安时)额外循环48个电池。在这种情况下,每个电池再次受到100个两级CC充电和一级CC放电的循环,在每个循环开始时随机选择三个速率。然而,我们现在通过为每个电池提供不同的电流分布使问题更具挑战性,以复制不同的电池用户彼此具有不同的平均使用模式,但仍然表现出随机的周期到周期行为的场景。在这些电池中,有16个也在35°C的较高工作温度下循环。
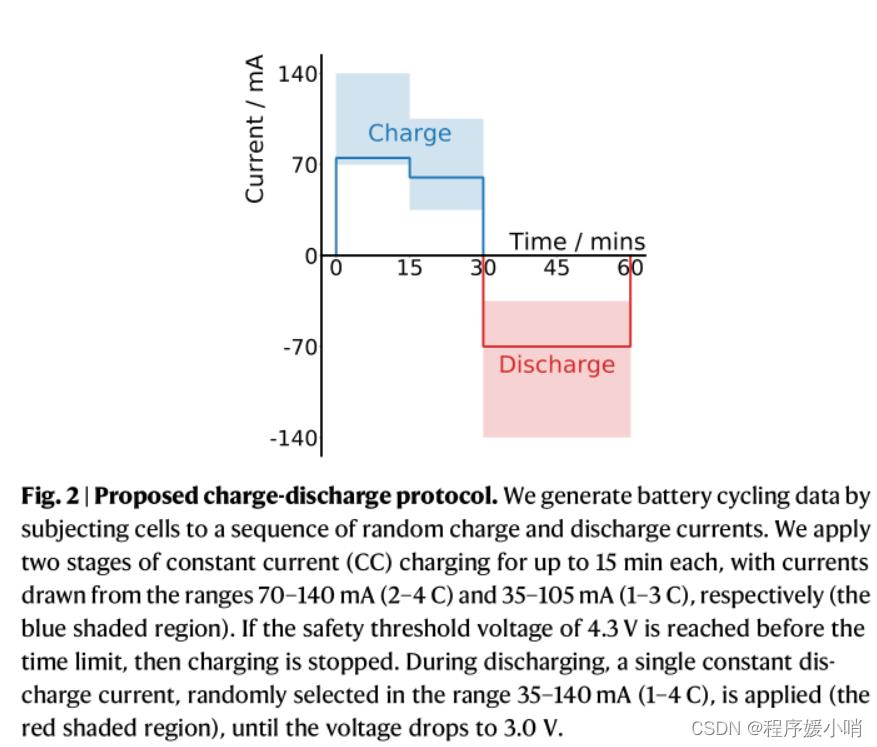
Fig. 2 | Proposed charge-discharge protocol. We generate battery cycling data by subjecting cells to a sequence of random charge and discharge currents. We apply two stages of constant current (CC) charging for up to 15 min each, with currents drawn from the ranges 70–140 mA (2–4 C ) a n d 3 5–105 mA (1–3 C), respectively (the blue shaded region). If the safety threshold voltage of 4.3 V is reached before the time limit, then charging is stopped. During discharging, a single constant discharge current, randomly selected in the range 35–140 mA (1–4 C), is applied (the red shaded region), until the voltage drops to 3.0 V.
图2 |提出的充放电协议。我们通过将电池置于一系列随机充放电电流中来生成电池循环数据。我们采用两级恒流(CC)充电,每级充电长达15分钟,电流分别从70-140 mA (2-4 C)和3 5-105 mA (1-3 C)的范围内抽出(蓝色阴影区域)。如果在时间限制之前达到4.3 V的安全阈值电压,则停止充电。在放电过程中,随机在35-140 mA (1-4 C)范围内选择一个恒定的放电电流(红色阴影区域),直到电压降至3.0 V。
Capacity forecasting using EIS
We first consider the setting in which we want to predict the next cycle discharge capacity, for a cell whose usage history (including for example, cycle or calendar age, or historical capacity–voltage data) is completely unknown, if we apply a particular charging and discharging profile. We frame the problem as a regression task, and train a probabilistic machine learning model to learn the mapping Q n = f ( s n , a n ) Q_n = f(s_n, a_n) Qn=f(sn,an), with uncertainty estimates, where s n s_n sn is the battery state at the start of the nth cycle, an is the future action (the nth cycle charge/ discharge protocol), and Qn is the discharge capacity measured at the end of the cycle. The battery state vector sn is formed from the concatenation of the real ( Z r e Z_re Zre)and imaginary( Z i m Z_im Zim ) components of the impedance measured at 57 frequencies, ω 1 , … ω 57 ω_1,…ω_57 ω1,…ω57, in the range 0.02Hz-20kHz; s n = [ Z r e ( ω 1 ) , Z i m ( ω 1 ) , . . . , Z r e ( ω 57 ) , Z i m ( ω 57 ) ] s_n =[Z_re(ω_1),Z_im(ω_1),...,Z_re(ω_57),Z_im(ω_57)] sn=[Zre(ω1),Zim(ω1),...,Zre(ω57),Zim(ω57)]. The action vector is formed from the concatenation of the nth cycle charge and discharge currents.
如果我们应用特定的充放电剖面,我们首先考虑我们想要预测下一个周期放电容量的设置,对于一个使用历史(例如,周期或日历年龄,或历史容量-电压数据)完全未知的电池。我们将问题框架为一个回归任务,并训练一个概率机器学习模型来学习映射 Q n = f ( s n , a n ) Q_n = f(s_n, a_n) Qn=f(sn,an),具有不确定性估计,其中 s n s_n sn是第 n n n个循环开始时的电池状态,an是未来的动作(第n个循环充电/放电协议), Q n Q_n Qn是循环结束时测量的放电容量。电池状态矢量 s n s_n sn在57个频率下测量的阻抗的实( Z r e Z_re Zre)和虚( Z i m Z_im Zim)分量的串联形成, ω 1 , … ω 57 ω_1,…ω_57 ω1,…ω57,在0.02Hz-20kHz范围内; s n = [ Z r e ( ω 1 ) , Z i m ( ω 1 ) , . . . , Z r e ( ω 57 ) , Z i m ( ω 57 ) ] s_n =[Z_re(ω_1),Z_im(ω_1),...,Z_re(ω_57),Z_im(ω_57)] sn=[Zre(ω1),Zim(ω1),...,Zre(ω57),Zim