Android图表库MPAndroidChart——散点图的孪生兄弟气泡图
Posted 刘某人程序员
tags:
篇首语:本文由小常识网(cha138.com)小编为大家整理,主要介绍了Android图表库MPAndroidChart——散点图的孪生兄弟气泡图相关的知识,希望对你有一定的参考价值。
android图表库MPAndroidChart(十)——散点图的孪生兄弟气泡图
起泡图和散点图如出一辙,但是个人认为要比散点图好看一点,我们来看下实际的演示效果
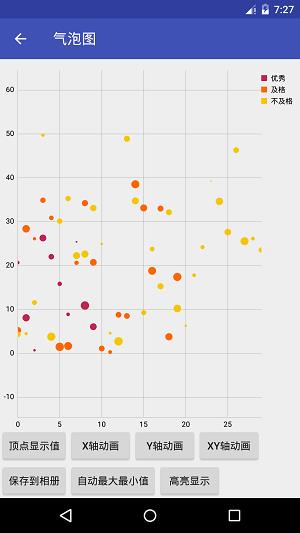
这个和散点图的实现很相似,我们一起来看下
一.基本实现
先看下我的xml
<com.github.mikephil.charting.charts.BubbleChart
        android:id="@+id/mBubbleChart"
        android:layout_width="match_parent"
        android:layout_height="0dp"
        android:layout_weight="1"/>
用的是BubbleChart这个View,再来初始化下
        //起泡图
        mBubbleChart = (BubbleChart) findViewById(R.id.mBubbleChart);

        mBubbleChart.getDescription().setEnabled(false);
        mBubbleChart.setOnChartValueSelectedListener(this);
        mBubbleChart.setDrawGridBackground(false);
        mBubbleChart.setTouchEnabled(true);
        mBubbleChart.setDragEnabled(true);
        mBubbleChart.setScaleEnabled(true);
        mBubbleChart.setMaxVisibleValueCount(200);
        mBubbleChart.setPinchZoom(true);

        Legend l = mBubbleChart.getLegend();
        l.setVerticalAlignment(Legend.LegendVerticalAlignment.TOP);
        l.setHorizontalAlignment(Legend.LegendHorizontalAlignment.RIGHT);
        l.setOrientation(Legend.LegendOrientation.VERTICAL);
        l.setDrawInside(false);

        YAxis yl = mBubbleChart.getAxisLeft();
        yl.setSpaceTop(30f);
        yl.setSpaceBottom(30f);
        yl.setDrawZeroLine(false);

        mBubbleChart.getAxisRight().setEnabled(false);

        XAxis xl = mBubbleChart.getXAxis();
        xl.setPosition(XAxis.XAxisPosition.BOTTOM);

        setData();
很简单,设置一些假数据
    //设置数据
    private void setData() {

        ArrayList<BubbleEntry> yVals1 = new ArrayList<BubbleEntry>();
        ArrayList<BubbleEntry> yVals2 = new ArrayList<BubbleEntry>();
        ArrayList<BubbleEntry> yVals3 = new ArrayList<BubbleEntry>();

        for (int i = 0; i < 10; i++) {
            float val = (float) (Math.random() * 30);
            float size = (float) (Math.random() * 40);

            yVals1.add(new BubbleEntry(i, val, size));
        }

        for (int i = 0; i < 20; i++) {
            float val = (float) (Math.random() * 40);
            float size = (float) (Math.random() * 50);

            yVals2.add(new BubbleEntry(i, val, size));
        }

        for (int i = 0; i < 30; i++) {
            float val = (float) (Math.random() * 50);
            float size = (float) (Math.random() * 60);

            yVals3.add(new BubbleEntry(i, val, size));
        }

        BubbleDataSet set1 = new BubbleDataSet(yVals1, "优秀");
        //可以谁知alpha
        set1.setColor(ColorTemplate.COLORFUL_COLORS[0]);
        set1.setDrawValues(true);
        BubbleDataSet set2 = new BubbleDataSet(yVals2, "及格");
        set2.setColor(ColorTemplate.COLORFUL_COLORS[1]);
        set2.setDrawValues(true);
        BubbleDataSet set3 = new BubbleDataSet(yVals3, "不及格");
        set3.setColor(ColorTemplate.COLORFUL_COLORS[2]);
        set3.setDrawValues(true);

        ArrayList<IBubbleDataSet> dataSets = new ArrayList<IBubbleDataSet>();
        dataSets.add(set1);
        dataSets.add(set2);
        dataSets.add(set3);

        BubbleData data = new BubbleData(dataSets);
        data.setDrawValues(false);
        data.setValueTextSize(8f);
        data.setValueTextColor(Color.WHITE);
        data.setHighlightCircleWidth(1.5f);

        mBubbleChart.setData(data);
        mBubbleChart.invalidate();

        //默认动画
        mBubbleChart.animateXY(3000, 3000);
    }
这样就大功告成了,和之前的散点图一样了
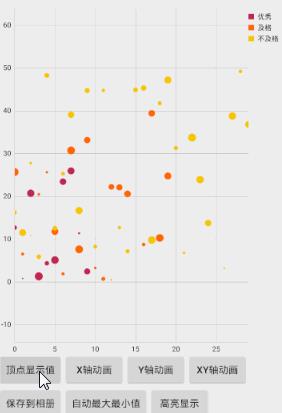
二.显示顶点
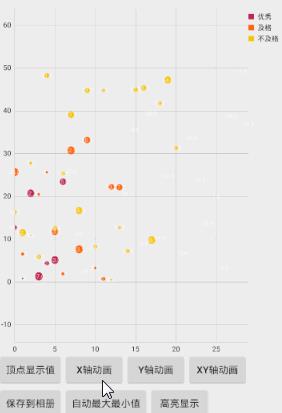
三.X轴动画
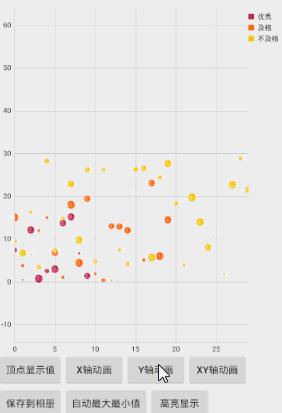
四.Y轴动画
五.XY轴动画
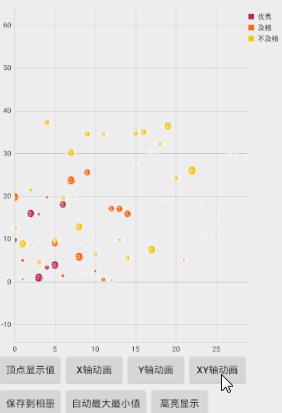
嘻嘻,很简单对不对,那我们现在来看下全部的代码
activity_bubble.xml
<?xml version="1.0" encoding="utf-8"?>
<LinearLayout
    xmlns:android="http://schemas.android.com/apk/res/android"
    android:layout_width="match_parent"
    android:layout_height="match_parent"
    android:orientation="vertical">

    <com.github.mikephil.charting.charts.BubbleChart
        android:id="@+id/mBubbleChart"
        android:layout_width="match_parent"
        android:layout_height="0dp"
        android:layout_weight="1"/>

    <LinearLayout
        android:layout_width="match_parent"
        android:layout_height="wrap_content"
        android:orientation="horizontal">


        <Button
            android:id="@+id/btn_show_values"
            android:layout_width="wrap_content"
            android:layout_height="wrap_content"
            android:text="顶点显示值"/>

        <Button
            android:id="@+id/btn_anim_x"
            android:layout_width="wrap_content"
            android:layout_height="wrap_content"
            android:text="X轴动画"/>

        <Button
            android:id="@+id/btn_anim_y"
            android:layout_width="wrap_content"
            android:layout_height="wrap_content"
            android:text="Y轴动画"/>

        <Button
            android:id="@+id/btn_anim_xy"
            android:layout_width="wrap_content"
            android:layout_height="wrap_content"
            android:text="XY轴动画"/>


    </LinearLayout>

    <LinearLayout
        android:layout_width="match_parent"
        android:layout_height="wrap_content"
        android:orientation="horizontal">


        <Button
            android:id="@+id/btn_save_pic"
            android:layout_width="wrap_content"
            android:layout_height="wrap_content"
            android:text="保存到相册"/>

        <Button
            android:id="@+id/btn_auto_mix_max"
            android:layout_width="wrap_content"
            android:layout_height="wrap_content"
            android:text="自动最大最小值"/>

        <Button
            android:id="@+id/btn_actionToggleHighlight"
            android:layout_width="wrap_content"
            android:layout_height="wrap_content"
            android:text="高亮显示"/>

    </LinearLayout>
</LinearLayout>
BubbleChartActivity
public class BubbleChartActivity extends BaseActivity implements OnChartValueSelectedListener, View.OnClickListener {

    private BubbleChart mBubbleChart;

    //显示顶点值
    private Button btn_show_values;
    //x轴动画
    private Button btn_anim_x;
    //y轴动画
    private Button btn_anim_y;
    //xy轴动画
    private Button btn_anim_xy;
    //保存到sd卡
    private Button btn_save_pic;
    //切换自动最大最小值
    private Button btn_auto_mix_max;
    //高亮显示
    private Button btn_actionToggleHighlight;

    @Override
    protected void onCreate(Bundle savedInstanceState) {
        super.onCreate(savedInstanceState);
        setContentView(R.layout.activity_bubble);

        initView();
    }

    //初始化View
    private void initView() {

        //基本控件
        btn_show_values = (Button) findViewById(R.id.btn_show_values);
        btn_show_values.setOnClickListener(this);
        btn_anim_x = (Button) findViewById(R.id.btn_anim_x);
        btn_anim_x.setOnClickListener(this);
        btn_anim_y = (Button) findViewById(R.id.btn_anim_y);
        btn_anim_y.setOnClickListener(this);
        btn_anim_xy = (Button) findViewById(R.id.btn_anim_xy);
        btn_anim_xy.setOnClickListener(this);
        btn_save_pic = (Button) findViewById(R.id.btn_save_pic);
        btn_save_pic.setOnClickListener(this);
        btn_auto_mix_max = (Button) findViewById(R.id.btn_auto_mix_max);
        btn_auto_mix_max.setOnClickListener(this);
        btn_actionToggleHighlight = (Button) findViewById(R.id.btn_actionToggleHighlight);
        btn_actionToggleHighlight.setOnClickListener(this);


        //起泡图
        mBubbleChart = (BubbleChart) findViewById(R.id.mBubbleChart);

        mBubbleChart.getDescription().setEnabled(false);
        mBubbleChart.setOnChartValueSelectedListener(this);
        mBubbleChart.setDrawGridBackground(false);
        mBubbleChart.setTouchEnabled(true);
        mBubbleChart.setDragEnabled(true);
        mBubbleChart.setScaleEnabled(true);
        mBubbleChart.setMaxVisibleValueCount(200);
        mBubbleChart.setPinchZoom(true);

        Legend l = mBubbleChart.getLegend();
        l.setVerticalAlignment(Legend.LegendVerticalAlignment.TOP);
        l.setHorizontalAlignment(Legend.LegendHorizontalAlignment.RIGHT);
        l.setOrientation(Legend.LegendOrientation.VERTICAL);
        l.setDrawInside(false);

        YAxis yl = mBubbleChart.getAxisLeft();
        yl.setSpaceTop(30f);
        yl.setSpaceBottom(30f);
        yl.setDrawZeroLine(false);

        mBubbleChart.getAxisRight().setEnabled(false);

        XAxis xl = mBubbleChart.getXAxis();
        xl.setPosition(XAxis.XAxisPosition.BOTTOM);

        setData();
    }

    //设置数据
    private void setData() {

        ArrayList<BubbleEntry> yVals1 = new ArrayList<BubbleEntry>();
        ArrayList<BubbleEntry> yVals2 = new ArrayList<BubbleEntry>();
        ArrayList<BubbleEntry> yVals3 = new ArrayList<BubbleEntry>();

        for (int i = 0; i < 10; i++) {
            float val = (float) (Math.random() * 30);
            float size = (float) (Math.random() * 40);

            yVals1.add(new BubbleEntry(i, val, size));
        }

        for (int i = 0; i < 20; i++) {
            float val = (float) (Math.random() * 40);
            float size = (float) (Math.random() * 50);

            yVals2.add(new BubbleEntry(i, val, size));
        }

        for (int i = 0; i < 30; i++) {
            float val = (float) (Math.random() * 50);
            float size = (float) (Math.random() * 60);

            yVals3.add(new BubbleEntry(i, val, size));
        }

        BubbleDataSet set1 = new BubbleDataSet(yVals1, "优秀");
        //可以谁知alpha
        set1.setColor(ColorTemplate.COLORFUL_COLORS[0]);
        set1.setDrawValues(true);
        BubbleDataSet set2 = new BubbleDataSet(yVals2, "及格");
        set2.setColor(ColorTemplate.COLORFUL_COLORS[1]);
        set2.setDrawValues(true);
        BubbleDataSet set3 = new BubbleDataSet(yVals3, "不及格");
        set3.setColor(ColorTemplate.COLORFUL_COLORS[2]);
        set3.setDrawValues(true);

        ArrayList<IBubbleDataSet> dataSets = new ArrayList<IBubbleDataSet>();
        dataSets.add(set1);
        dataSets.add(set2);
        dataSets.add(set3);

        BubbleData data = new BubbleData(dataSets);
        data.setDrawValues(false);
        data.setValueTextSize(8f);
        data.setValueTextColor(Color.WHITE);
        data.setHighlightCircleWidth(1.5f);

        mBubbleChart.setData(data);
        mBubbleChart.invalidate();

        //默认动画
        mBubbleChart.animateXY(3000, 3000);
    }

    @Override
    public void onValueSelected(Entry e, Highlight h) {

    }

    @Override
    public void onNothingSelected() {

    }

    @Override
    public void onClick(View v) {
        switch (v.getId()) {
            //显示顶点值
            case R.id.btn_show_values:
                for (IDataSet set : mBubbleChart.getData().getDataSets())
                    set.setDrawValues(!set.isDrawValuesEnabled());

                mBubbleChart.invalidate();
                break;
            //x轴动画
            case R.id.btn_anim_x:
                mBubbleChart.animateX(3000);
                break;
            //y轴动画
            case R.id.btn_anim_y:
                mBubbleChart.animateY(3000);
                break;
            //xy轴动画
            case R.id.btn_anim_xy:
                mBubbleChart.animateXY(3000, 3000);
                break;
            //保存到sd卡
            case R.id.btn_save_pic:
                if (mBubbleChart.saveToGallery("title" + System.currentTimeMillis(), 50)) {
                    Toast.makeText(getApplicationContext(), "保存成功",
                            Toast.LENGTH_SHORT).show();
                } else
                    Toast.makeText(getApplicationContext(), "保存失败",
                            Toast.LENGTH_SHORT).show();
                break;
            //切换自动最大最小值
            case R.id.btn_auto_mix_max:
                mBubbleChart.setAutoScaleMinMaxEnabled(!mBubbleChart.isAutoScaleMinMaxEnabled());
                mBubbleChart.notifyDataSetChanged();
                break;
            //高亮显示
            case R.id.btn_actionToggleHighlight:
                if (mBubbleChart.getData() != null) {
                    mBubbleChart.getData().setHighlightEnabled(
                            !mBubbleChart.getData().isHighlightEnabled());
                    mBubbleChart.invalidate();
                }
                break;
        }
    }
}
就是这么简单
有兴趣的加群:555974449
Sample:http://download.csdn.net/detail/qq_26787115/9689868
以上是关于Android图表库MPAndroidChart——散点图的孪生兄弟气泡图的主要内容,如果未能解决你的问题,请参考以下文章